Exactly one week ago I wrote the following:
My best guess is that we see some stabilization around the 50 day average. I would not be surprised by another quick and small bounce. But ultimately I am expecting $SPY to trade beneath the 50 day average, within a week.
That prognostication came at the end of a series of posts where I explained how I used a couple of breadth indicators to predict and gauge the strength of bounces.
I was wrong about the $SPY trading beneath the 50 day average within a week, and the bounce was stronger than I expected. However, it appears as if the correction will continue, and $SPY looks as if it may close beneath the 50 day as early as tomorrow (Thursday). So maybe I was off by a day. The most important point is that these breadth indicators do a nice job of calling short-term market swings.
The indicators by themselves help a lot, but they should be combined with experience for the best results. Since I believe that we are in a corrective phase, my experience tells me that we will see less trending and more mean reversion until the correction is over. This means that up and down swings are to be expected, which is why I figured the market would be headed back down, within a week.
Another way of looking at this is to consider that today’s move was less about Bernanke and more about the market being in a corrective phase. Trending markets don’t move up and down + or -1% several times a week. Markets in a corrective phase do experience the large swings.
All that being said, what are the breadth indicators indicating?
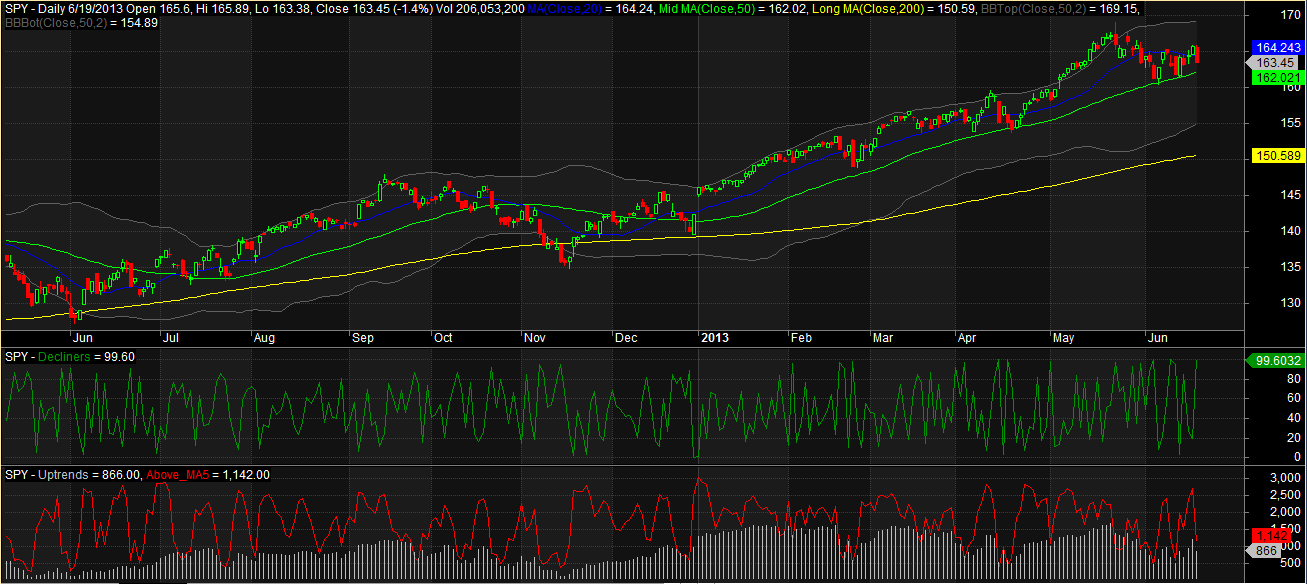
The very short term Decline Line Indicator (green line) is reading 99.6, which means that stabilization, or a bounce, is imminent.
The short-term Number of Stocks Beneath Their 5 Day Moving Average Indicator (red line) is at 1142. This indicator needs to be beneath 650 in order for me to expect a tradeable bounce.
I’m still expecting a close beneath the 50 day average, but the extreme Decline Line Indicator reading means we may see a pause tomorrow, with the correction resuming shortly thereafter.