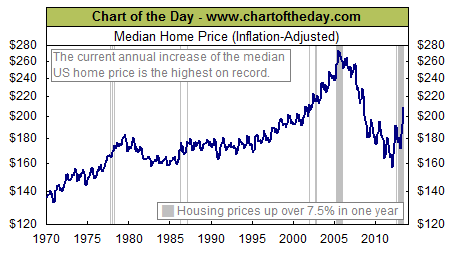
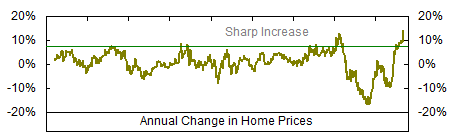
The US real estate market continues to surge. For some perspective, today’s top chart illustrates the US median price (adjusted for inflation) of a single-family home over the past 43 years while today’s bottom chart presents the annual percent change in home prices (also adjusted for inflation).
Today’s chart illustrates that the inflation-adjusted median home price has rarely increased more than 7.5% in one year (gray shading). When inflation-adjusted home prices did increase more than 7.5% in one year, it was often soon followed by a period of stagnant or declining prices. The exception to this occurred during the credit bubble (2001 and 2002). It is worth noting that over the past 12 months, the median price for a single-family home has shot up at the fastest pace on record.
Notes:
Does the real estate rally continue? The answer may surprise you. Find out now with the exclusive & highly regarded charts of Chart of the Day Plus.