We can update three of the four charts that I’m using to track when the Fed will start tapering the QE3 purchases.
The September FOMC meeting is on the 17th and 18th. The only data relevant for these charts that will be released between now and the September FOMC meeting is the August unemployment rate that will be released this coming Friday.
At the June FOMC press conference, Fed Chairman Ben Bernanke said:
“If the incoming data are broadly consistent with this forecast, the Committee currently anticipates that it would be appropriate to moderate the monthly pace of purchases later this year. And if the subsequent data remain broadly aligned with our current expectations for the economy, we would continue to reduce the pace of purchases in measured steps through the first half of next year, ending purchases around midyear. In this scenario, when asset purchases ultimately come to an end, the unemployment rate would likely be in the vicinity of 7%, with solid economic growth supporting further job gains, a substantial improvement from the 8.1% unemployment rate that prevailed when the committee announced this program.”
 Click on graph for larger image.
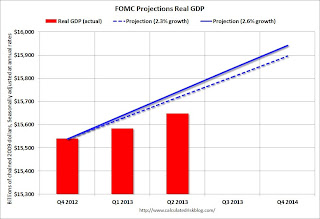
The first graph is for GDP.
The current forecast is for GDP to increase between 2.3% and 2.6% from Q4 2012 to Q4 2013.
Combined the first and second quarter were below the FOMC projections. GDP would have to increase at a 2.8% annual rate in the 2nd half to reach the FOMC lower projection, and at a 3.3% rate to reach the higher projection.

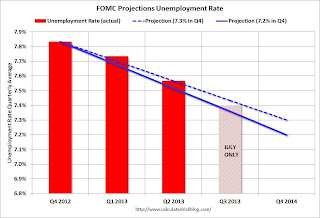
The second graph is for the unemployment rate.
The current forecast is for the unemployment rate to decline to 7.2% to 7.3% in Q4 2013.
We only have data through July, and so far the unemployment rate is tracking in the middle of the forecast.
If the participation rate ends the year at 63.6% (level for the year), then job growth will have to pickup up a little in the 2nd half to meet the FOMC projections. See the Atlanta Fed’s Jobs Calculator tool to estimate how many jobs per month will be needed to reach a certain unemployment level.
 This graph is for PCE prices.
The current forecast is for prices to increase 0.8% to 1.2% from Q4 2012 to Q4 2013.
So far PCE prices are close to this projection – however this projection is significantly below the FOMC target of 2%. Clearly the FOMC expects inflation to pickup, and a key is if the recent decline in inflation is “transitory”.
PCE prices wouldn’t have to increase much over the next five months to reach the upper FOMC projection.
 This graph is for core PCE prices.
The current forecast is for core prices to increase 1.2% to 1.3% from Q4 2012 to Q4 2013.
So far core PCE prices are below this projection – and, once again, this projection is significantly below the FOMC target of 2%.
With the upward revision to Q2 GDP, and the low expectations for inflation (significantly below target), it now looks the year-end data might be “broadly consistent” with the June FOMC projections.