Read Part 1 HERE
Then, once screened, how do you go about looking for the best setups? what patterns, charts, technicals, or other factors, etc. do you favor in determining such picks?
It’s all about multiple timeframes.
Initially, when screening and scanning, I’m looking at a daily chart, not an intraday chart (there is a difference). I’m looking for recognizable chart patterns to flag a ticker. This will become easier with experience. Once the ticker is flagged, it is placed in my watchlist, and the analysis begins:
I start with the weekly chart using a volume profile. Option Addict has done a great job in helping me look for price targets using volume profile analysis. I’m simply looking for levels to identify action points in a stock. I then dial it down to the daily chart, 30 minute chart, 15, then 5 minute chart.
I have a checklist, with questions I ask myself before entering a trade, where certain criteria must be met in order for me to initiate a trade. The single most important factor I’ve found in my trading, is the question, “Did you check the 30 minute chart?”
The 30 minute chart gives you the clear picture and is the single best timeframe to find your trigger price. The next question on my checklist then becomes, “Where is the action point / trigger?”
Lets’s use the KIOR trade from Friday to to find our action point using the 30 minute chart:
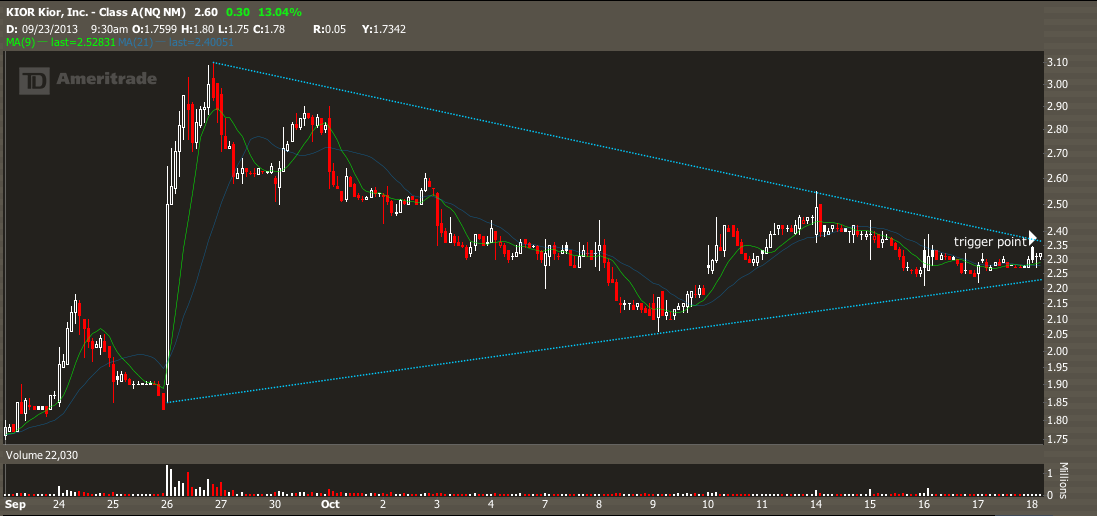
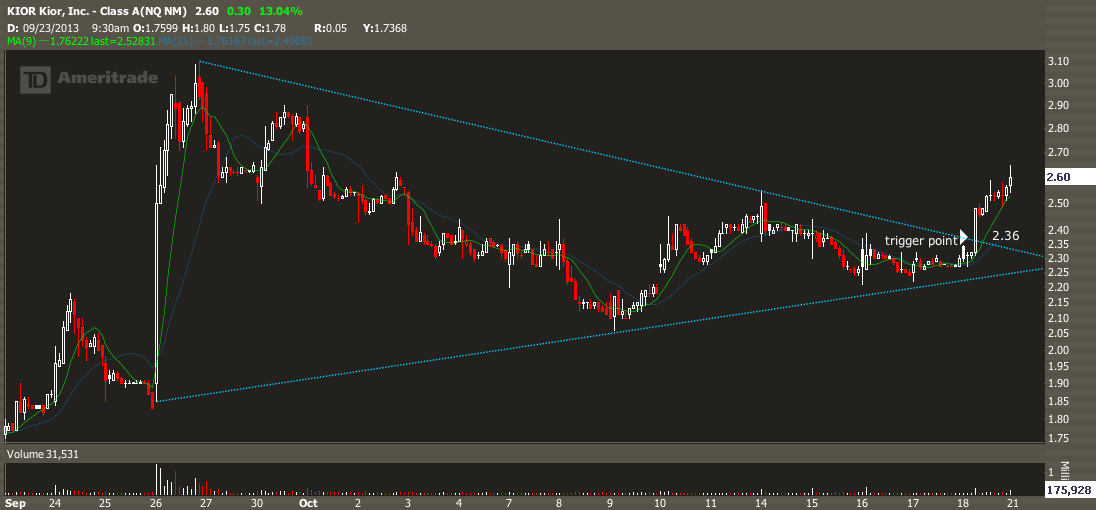
The chart above is what I was looking at on Friday to determine my trigger point. I decided if the stock traded with volume through 2.35-2.36, I would take the trade.
Notice what happened once the stock traded past that level:
______
Now in order for me to view the 30 minute timeframe, there had to be something I saw in the daily or weekly chart that peaked my interest. This is where experience starts to kick in as you develop an eye for particular chart patterns. Or, where you search my blog for ideas near trigger points.
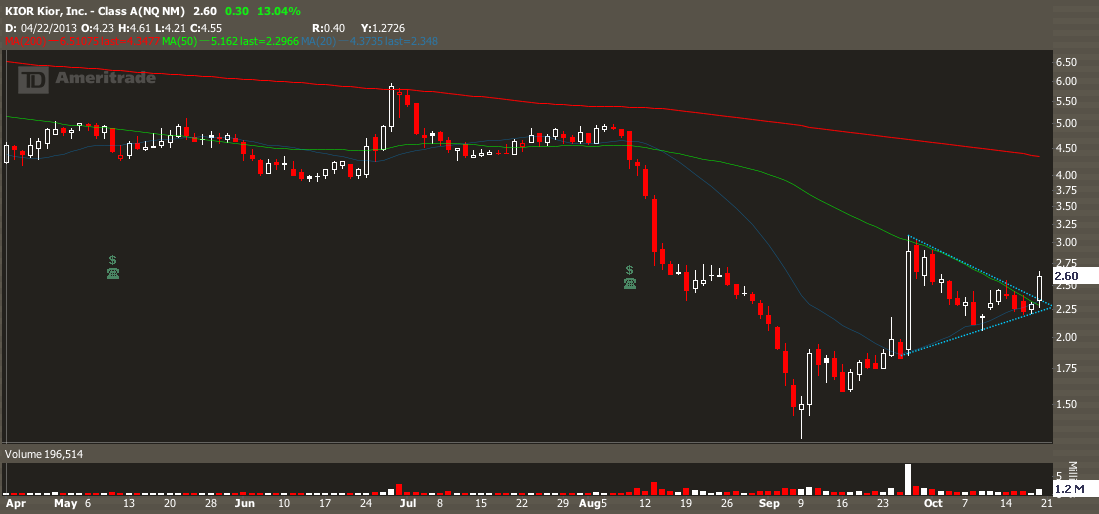
So let’s go through the process together, KIOR ends up landing on the small bombs & runner screen. I flag it because of the symmetrical pattern found on the daily chart. The fact that the 50 & 20 day moving averages were near my trigger was a bonus:
 ___
___
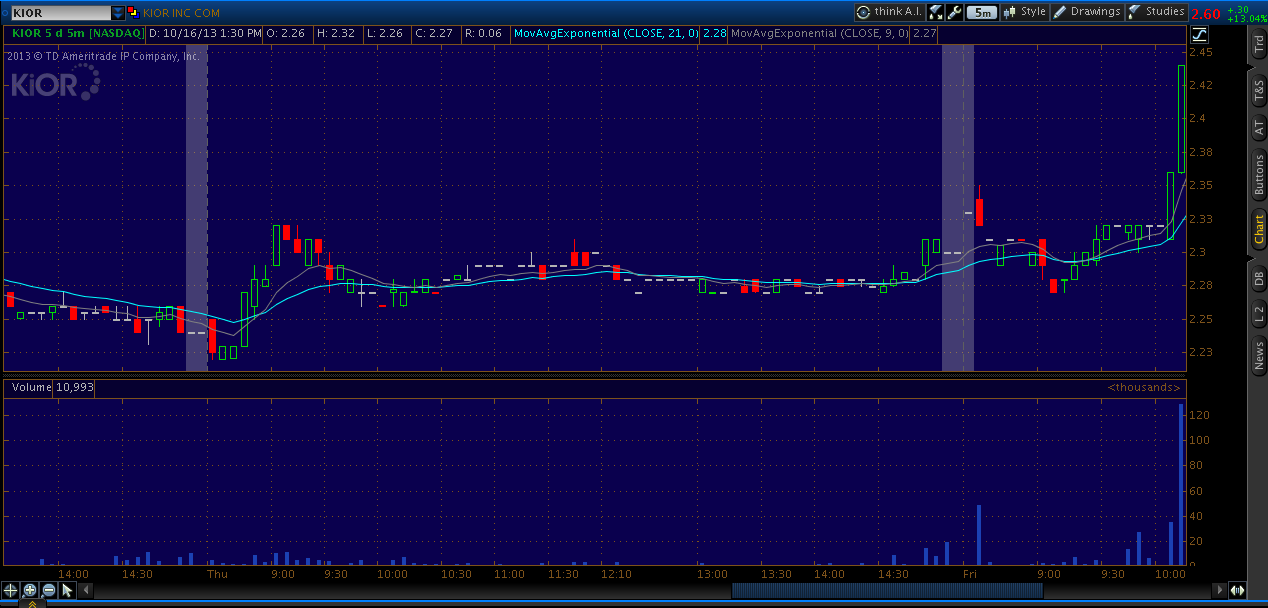
Then, I proceed to dial it down to the 30 minute chart as showed in the previous chart. I find my action point, which in this case was 2.35- 2.36. Then, I watch it on the 5 minute chart and wait for volume to show up at my trigger. If I get my volume, I take the trade.
Notice the volume showing up right at my trigger on the 5 minute chart intraday (I took the trade):
In a nutshell, it’s all about multiple timeframes and recognizing chart patterns. Pattern recognition will come with experience, I promise. Dial down your charts analyzing them in multiple time frames, and I promise your trading account will thank you.
If you are interested in trading these setups along side with me, please visit our trading room, 12631.