The Federal Reserve announced that the ‘big bad taper’ will stay in the closet. That’s good news. The Fed announced the same thing on September 18, which led to a three-week correction. The same thing happened in late July.
You know the spiel. When there’s a Federal Reserve meeting on Wednesday, the stock market (NYSEArca: VTI) takes a hiatus until Mr. Bernanke makes his announcement.
There’s a Federal Open Market Committee (FOMC) meeting about every 45 days or eight times a year.
More often than not the S&P 500 has a positive bias going into the FOMC meeting, but the S&P 500 ETF has lost its mojo after each of the last three FOMC meetings.
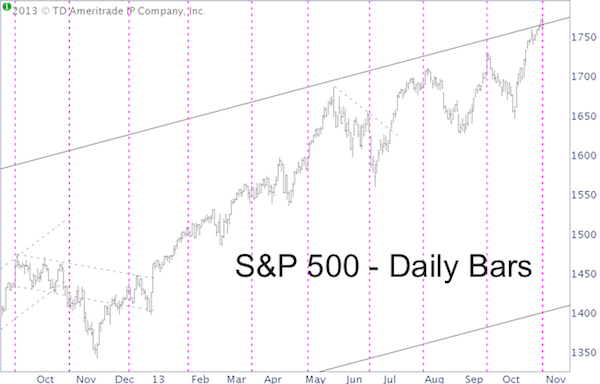
The S&P 500 chart below illustrates the S&P’s performance after the last 10 FOMC meetings.

This chart covers an incredibly bullish time period, but it’s interesting to note that – since September 2012 – the S&P 500 dropped below the FOMC meeting high every single time within the next few weeks.
More remarkable than the S&P’s post FOMC performance history is the S&P’s pre FOMC performance history.
An official Federal Reserve study shows that the ‘pre FOMC drift’ (optimism leading up to the FOMC announcement) accounts for all S&P 500 gains over the last two decades.
In other words, pre FOMC gains inflated the S&P 500 to an unbelievable degree. A full analysis (with shocking charts) of the Federal Reserve study is available here:
New York Fed Research Reveals That FOMC Drove S&P XX% Above Fair Value