Much has been written about the ‘great rotation’ from bonds into stocks. In reality, investors ask themselves every day if there’s more value in stocks or bonds. There’s one accurate measure to determine where’s more value.
Stocks or bonds? Essentially that’s a decision investors make every day.
As with pretty much every other purchase, investors want to get the biggest bang for their buck and avoid risk. In other words, risk/reward is key.
What’s the better risk/reward play right now? Stocks or bonds?
To find out we will take a look at the value of the S&P 500 Index relative to 10-year Treasury prices. The iShares 7-10 Year Treasury Bond ETF (NYSEArca: IEF) is used as proxy for 10-year Treasuries.
The chart below plots the S&P 500 Index against a ratio attained by dividing the S&P 500 against the price of IEF (S&P 500:IEF).
This is one of the easiest and most effective ways to determine the value of both asset classes relative to each other.
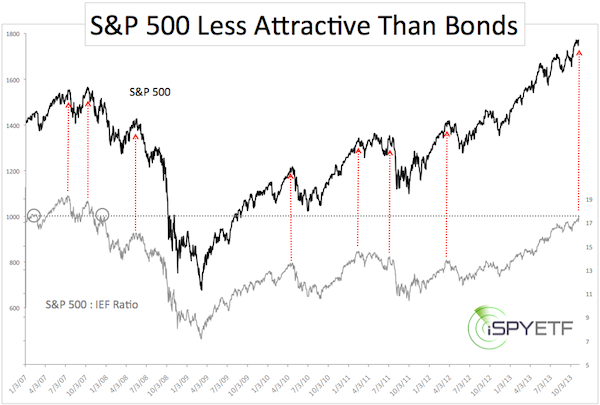
The chart shows that S&P 500:IEF ratio extremes put the kibosh on stocks every time. The degree of the correction varied, but the direction for the S&P 500 was the same every time – down.
There is one problem though.
It usually takes hindsight to determine what constitutes an S&P 500:IEF ratio extreme.
The ratio, although extreme right now, could become more stretched. Will it?
The dashed horizontal gray line shows today’s ratio in correlation to prior readings. In fact, the ratio is at a point where it turned down in early 2007 and early 2008. This appears as natural resistance for the ratio … and the S&P 500.
The S&P 500:IEF ratio suggests that risk is increasing for the S&P 500.
This harmonizes with the S&P 500 chart, which conveys the message that stocks are at a short-term inflection point. This article highlights some technical ‘speed bumps’ most investors aren’t aware of: What’s Next For the S&P 500?