Ben Bernanke and his inkjets have generously supplied the financial media with a never-ending and convenient, one size fits all supply of hindsight explanations, a herd of virtual scapegoats.
It’s the good news = good news / bad news = good news phenomenon.
Bad economic news is good for the S&P 500 (SNP: ^GSPC) because it will force the Fed to print and pump.
Good economic news is good for the S&P 500 because it means business is actually improving.
The media’s cookie cutter hindsight interpretation of the S&P 500 (NYSEArca: SPY) or any other major market index looks something like that when economic news is good and stocks are up (such as on Thursday):
“S&P 500 closes higher as jobless claims fall” or
“Dow Jones closes above 16,000 on jobless claims”
It looks something like this if the economic news is bad and stocks are up:
“Bad economic data fuels hope of continued asset purchases” or
“Jump in jobless claims cools fears of taper”
Don’t readers deserve better than this intelligence insulting commentary junk food?
Stop Milking the Scapegoat
I don’t claim to have all the answers, but I believe readers deserve a well-researched, ‘home-cooked’ analysis of what’s going on. Actually, let me rephrase this: A well-researched analysis on what went on and what likely will go on.
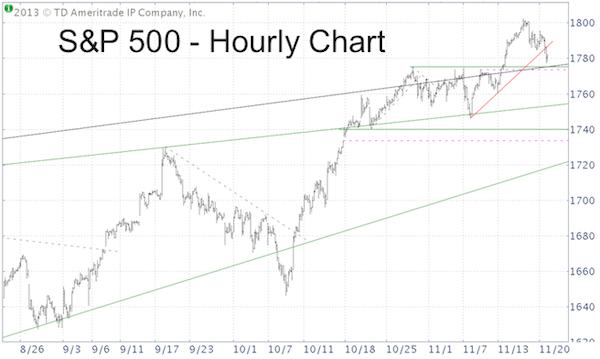
Here’s a simple example. The two S&P 500 charts below were featured in the November 20 Profit Radar Report update and provide a short and long-term look at the S&P 500.
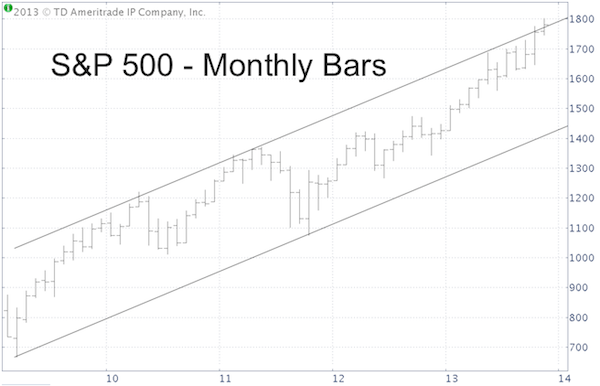
It shows that the S&P 500 closed above long-term trend channel support and key short-term support on Wednesday. This is net bullish and should lead to marginal new highs as long as the S&P 500 stays above key support (forgive me for reserving the exact stop-loss level for the eyes of subscribers to the Profit Radar Report).
Additionally, the November 17 Profit Radar Report update provided a specific up side target for this rally. Since the structure of the Dow Jones (NYSEArca: DIA) is the cleanest, the up side target is based on the Dow Jones.
You actually don’t have to be a subscriber to get access to the Dow Jones up side target. It is provided for free right here:
Forget Dow 16,000 – Here’s the Real ‘Bubble Popper’
Of course, the problem with sticking your head out the window and making actionable predictions is that I might be wrong (which has happened and will happen again).
Fortunately, I’ve found that readers that appreciate the effort it takes crafting actionable market analysis understand that no one has a crystal ball.
My analysis, including forecasts and actionable recommendations for all major asset classes is available via the Profit Radar Report.
Simon Maierhofer is the publisher of the Profit Radar Report. The Profit Radar Report uses technical analysis, dozens of investor sentiment gauges, seasonal patterns and a healthy portion of common sense to spot low-risk, high probability trades (see track record below).
Follow Simon on Twitter @ iSPYETF or sign up for the iSPYETF Newsletter to get actionable ETF trade ideas delivered for free.
