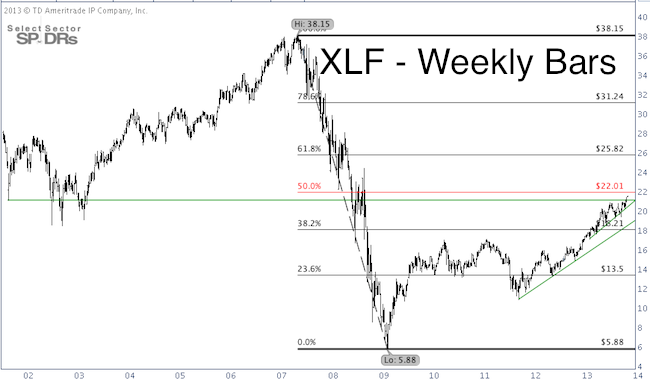
The Financial Select Sector SPDR ETF (XLF) is leading the charge to new (recovery) highs. Unlike the major market indexes, XLF is still having to deal with overhead resistance, such as this solid Fibonacci level.
People dislike injustice and QE is a blatant display of injustice. The Federal Reserve is helping out big banks while the little guy is left holding the bag.
Whether we like it or not, the financial sector is leading the latest charge to new all-time highs for the Dow Jones and S&P 500.
The Financial Select Sector SPDR ETF (NYSEArca: XLF) has broken above resistance provided by the September 2001 low and is heading for the next technical milestone – the 50% Fibonacci retracement (see XLF chart below).
The 50% Fibonacci retracement at 22.01 was isolated as target for this rally in my July 12 analysis of the XLF ETF.

Despite recent strength, the Financial Select Sector SPDR ETF still hasn’t even recovered 50% of the points lost from 2007 – 2009.
As of today, the Financial Select Sector SPDR ETF is about 2% away from the 50% Fibonacci retracement.
The SPDR S&P Bank ETF (NYSEArca: KBE) is about 5% away from its 50% Fibonacci retracement.
Does this Fibonacci level matter? The XLF chart chronicles how the financial ETF responded to the 23.6% and 38.2% Fibonacci levels.
The interaction with the 23.6% level was intense and saw a number of tests. The 38.2% level halted XLF’s advance just briefly.
It would be reasonable to expect some sort of reaction to the 50% Fibonacci level.
It’s a good idea to keep an eye on XLF (and KBE) here as the financial sector accounts for 16.19% of the S&P 500 (NYSEArca: SPY). This doesn't mean that the tail wags the dog, but the performance of XLF and KBE may provide a sneak peek for what's next for the S&P 500.
At the same time, the Dow Jones is reaching the long-term target we called for many months ago … and it's not Dow 16,000.
Reaching this Dow target has been more than a decade in the making: Forget Dow 16,000 – Here's the Real 'Bubble Popper'
Simon Maierhofer is the publisher of the Profit Radar Report. The Profit Radar Report uses technical analysis, dozens of investor sentiment gauges, seasonal patterns and a healthy portion of common sense to spot low-risk, high probability trades (see track record below).
Follow Simon on Twitter @ iSPYETF or sign up for the iSPYETF Newsletter to get actionable ETF trade ideas delivered for free.