My dissertation looked at currency demand at Christmas. Here’s what I discovered:
1. Between December and January of each year real currency demand falls.
2. The Fed accommodates that drop by decreasing the supply of currency by a roughly equal amount.
3. Hence prices change very little between December and January
4. The seasonal decline in percentage terms was much larger in the 1920s and 1970s than the 1940s.
5. The seasonal decline as a share of GDP is fairy stable. That’s because the cash/GDP ratio was far higher during the 1940s.
6. The seasonal decline was concentrated in coins and small bills.
Here’s what I concluded.
1. The seasonal variation in currency demand is due to transactions balances, not hoarding balances.
2. Hoarding demand (and thus total cash demand) rose sharply between the 1920s and 1940s due to falling interest rates (op. cost of holding currency) and rising tax rates (benefit of hiding wealth from government in the form of currency.) Between the 1940s and 1970s the ratio fell back to 1920s levels due to rising interest rates. The transactions demand for cash as a share of GDP varies relatively little over time.
3. In the 1920s people shopped with coins and small bills. By the 1970s coins could no longer be used to make significant purchases and were merely used for change in non-seasonal transactions (parking meters, phone booths, Coke machines, etc.) I seem to recall that coin seasonality dropped due to inflation, but am not certain. But big bill seasonality did not rise as much due to inflation as you’d expect, as consumers switched to credit cards and checks for big transactions.
4. Because the total cash ratio to GDP was high during the 1940s, but transactions use of cash was not particularly high, the seasonal drop-off was much lower in percentage terms. But still about the same in absolute terms, as a share of GDP.
5. Because large bills are hoarded they wear out much more slowly than small bills.
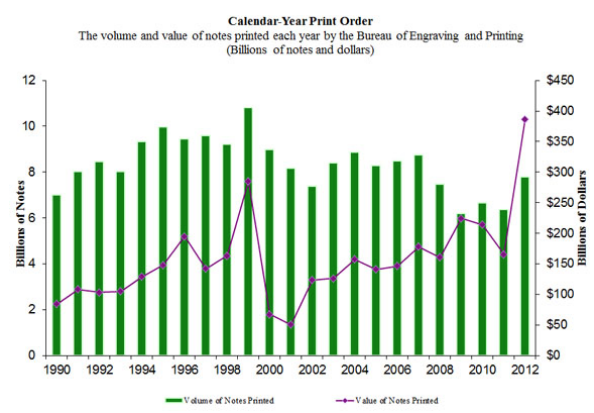
There was one policy implication that I did not discuss (or indeed realize until much later.) If we were going to go the “old monetarist” route of targeting the money supply, the optimal policy would not have been to target the quantity of money in value terms (which is distorted by hoarding), but rather the quantity of money by volume. I.e., the actual the number of green pieces of paper in circulation. Dollar bills and $100 bills each count as “one bill.” In the graph below you’ll notice that the value of currency produced by the government (purple line) actually rises in 2009. So money was not “tight” in that sense. But the volume of new currency notes issued (green bars) falls between 2000 and 2002, and also between 2007 and 2009. (Ignore the 1999 build-up for Y2k.) So money was tight in volume terms but not value terms. Why the difference?
Between 2007 and 2009 the interest rate fell to zero, making it much more attractive to hoard $100 bills as a way of avoiding taxes. In contrast, transactions fell during the recession; so fewer small bills were “needed.” I used the scare quotes because of course in a macro sense more small bills were “needed.” More precisely, a monetary policy regime was needed which would have produced a steady production level of bills by volume. That production is endogenous given the monetary regime, but responds to changes in goods and services transactions produced by changes in the policy regime. This post explains the idea in more detail, using coin production.
Have a Merry Christmas and Happy New Year. Or to my readers who do not celebrate Christmas, just a Happy New Year.
PS. Dylan pointed me to this funny satire by John Carney, which includes this blog.
