The chart discussed in this article shows why it is important to approach market analysis with an objective mind. A bearish analyst will see an undisputable sell signal, while an objective analyst (and a tweak of how the data is presented) shows a buy signal.
By now even the Geico cavemen should know that investors are overwhelmingly bullish, which is bearish for stocks.
However, the latest sentiment data, as you will see below, reveals the skittish nature of investors and a potential buy signal.
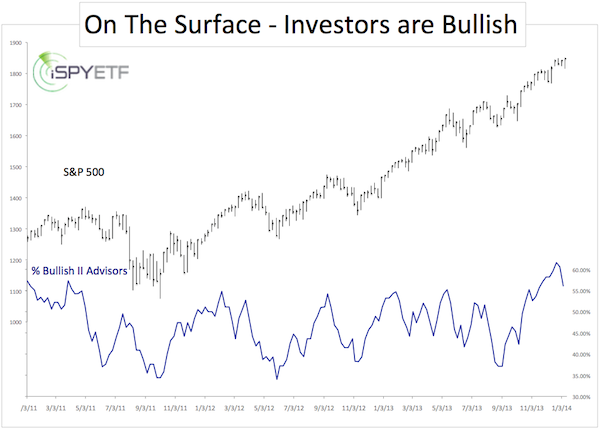
On Wednesday Investors Intelligence (II) reported that the percentage of bullish advisors and newsletter-writing colleagues has slipped from 60.6% to 56.1%.
I’ve seen and created many sentiment charts before. Below is one of them.

It plots the S&P 500 against the percentage of bullish advisors polled by II.
The chart shows exactly what it’s supposed to, a somewhat lower degree of bullishness.
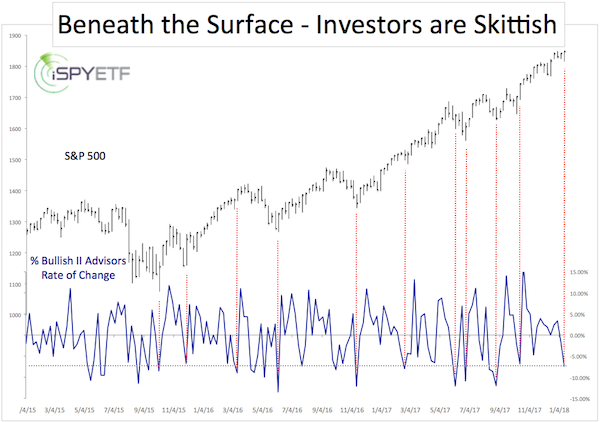
However, what the chart doesn’t show is the near-extreme level of skittishness.
The second chart plots the S&P 500 against the rate of change of bullish sentiment.

Advisors this week are 7.43% less bullish than last week. In the last couple of months the rate of change has dropped from +17.02% to –7.43%.
As the dashed red lines illustrate, in times past rates of change at 7% or below have generally been bullish for the S&P 500 (NYSEArca: SPY) and Dow Jones.
I would not view this unique rate of change indicator as a buy signal, but it does show that data often can be interpreted multiple ways.
It is important to analyze data without bias (some analysts massage data to fit their bias) and most importantly recognize the danger of a possible surprise move to the up side.
Having said that, the weight of evidence does suggest that a correction is near.
Here are 3 reasons why: The 3 Worst Pieces of News so Far in 2014
Simon Maierhofer is the publisher of the Profit Radar Report. The Profit Radar Report presents complex market analysis (stocks, gold, silver, euro and bonds) in an easy format. Technical analysis, sentiment indicators, seasonal patterns and common sense are all wrapped up into two or more easy-to-read weekly updates. All Profit Radar Report recommendations resulted in a 59.51% net gain in 2013.
Follow Simon on Twitter @ iSPYETF or sign up for the FREE iSPYETF Newsletter to get actionable ETF trade ideas delivered for free.
