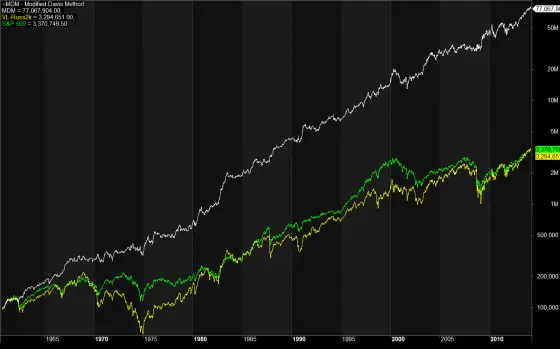
It’s been about 7 months since my first article on The Modified Davis Method appeared, so it’s time for an update. Here is the original chart updated through 3/28/14. As before, the top (white) line is the method’s results; the yellow line is the Value Line/Russell 2000 series; the green line is the S&P 500 for reference.
The method is still 100% long after the last buy on 11/30/12 when the Russell 2000 closed at 821.92. Since then the ETF that tracks the Russell 2000 (IWM) is up more than 42% with dividends reinvested.
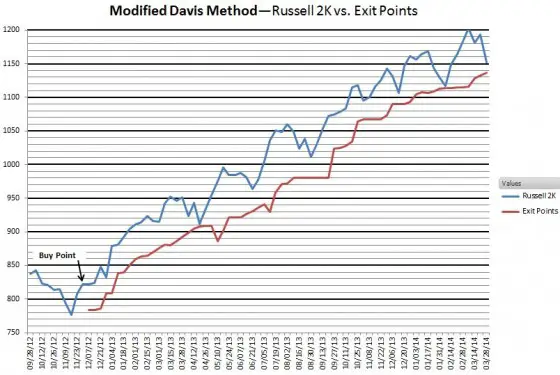
The following chart illustrates the method’s computed potential exit points since the Buy on 11/30/12. The upper line is the weekly close of the Russell 2000 index; the lower line depicts the exit points each week. The method has remained 100% long in the Russell 2000, despite several pullbacks and the usual plethora of predictions that the market is overvalued and cannot go much higher.
Additionally, the original 4% method would have exited and reentered 3 times during this rally, greatly reducing the gain compared to remaining 100% long. Searching for thresholds other than 4% and employing the dynamically-adjusted trend line have payed off handsomely this time.
The stop was just barely missed on 02/07/14. Since then, the stop has risen more than 23 points and is still rising. The method’s use of breadth suggests that the final top has not been reached. But, sooner or later an exit point will be breached, and soon thereafter, it will be reported here.

