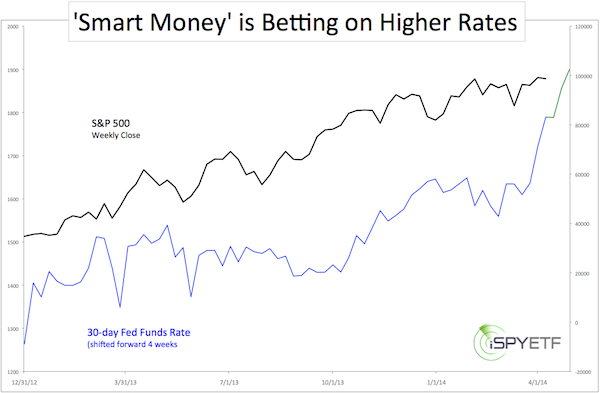
Here’s yet another indicator that the Federal Reserve legally ‘manipulates’ the stock market. This chart shows the correlation between the S&P 500 and the 30-day Fed Fund Rate. Based on this unique correlation, stocks should rally (at least temporarily).
Market correlations are never married for better or for worse or until death do they part, but they are valuable tools for market forecasters.
There are dozens of correlations. Some are logical and make sense, others are exotic and off the wall.
This piece is about the correlation between the S&P 500 (SNP: ^GSPC) and the 30-day Federal Funds Rate (30 FFR).
The Federal Funds Rate (FFR) is the interest for which a depository institution lends funds maintained at the Federal Reserve to other depository institutions.
The 30 FFR reflects the average daily FFR in a particular month and is investable via the 30-day Federal Funds Futures.
The Commitment of Traders Report (COT) provides a glimpse of how traders feel about the 30 FFR, and that’s where it gets interesting.
The COT tracks positions of commercial, non-commercial and non-reportable traders. Commercial traders are considered the ‘smart money.’
Commercial traders have been piling into the 30-day Federal Funds Futures, basically betting on a higher FFR.
The FFR essentially acts as the base rate that determines all other interest rates in the US.
There generally is a direct correlation between Treasury rates and stock prices. That’s what makes the 30 FFR an interesting forward-looking indicator.
How is it forward looking?
The chart below plots the S&P 500 against the 30 FFR shifted forward approximately 30 days or four weeks (the COT reports weekly).

The green portion of the 30 FFR chart reflects the outlook for the next four weeks.
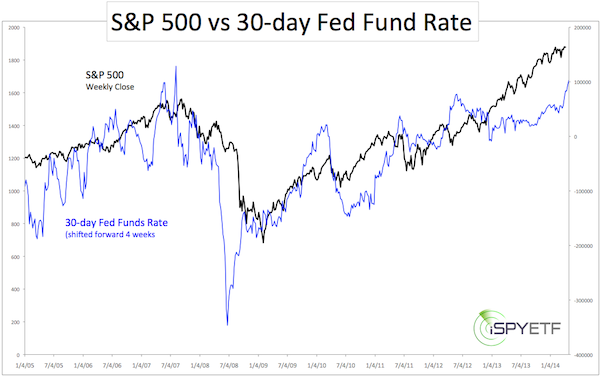
The second chart shows the long-term correlation between the S&P 500 and 30 FFR.

It’s worth noting that commercial traders’ 30 FFR long positions are near an all-time high. Therefore, up side could be limited.
For now, the Fed Funds Rate confirms what we foresaw already last week: Higher prices.
My thoughts, shared via the May 4 Profit Radar Report, were as follows: “The chart detective inside of me favors a shallow dip to 1,874 – 1,850 followed by a pop to 1,9xx (exact level reserved for subscribers) before we see a 10%+ correction.“
I expected higher prices not because the charts telegraphed it, but because of a non-scientific yet incredibly effective indicator. More details can be found here:
Too Many Bears Spoil the Crash (or Correction)
Simon Maierhofer is the publisher of the Profit Radar Report. The Profit Radar Report presents complex market analysis (S&P 500, Dow Jones, gold, silver, euro and bonds) in an easy format. Technical analysis, sentiment indicators, seasonal patterns and common sense are all wrapped up into two or more easy-to-read weekly updates. All Profit Radar Report recommendations resulted in a 59.51% net gain in 2013.
Follow Simon on Twitter @ iSPYETF or sign up for the FREE iSPYETF Newsletter to get actionable ETF trade ideas delivered for free.
