Last week the CBOE Equity Put/Call ratio slipped as low as 0.43, the lowest level since January 2011. Similar readings in April 2010 and April 2012 led to nasty sell offs? But something is different this time.
Last week the CBOE Equity Put/Call ratio plunged to 0.43, the lowest reading since January 2011. This wasn’t just a one-day fluke as the 5-day SMA fell as low as 0.518, also a 41-month extreme.
A ratio of 0.43 means that option traders bought 2.3 calls (bullish option bet) for every put (bearish option bet). Option traders don’t have a ‘smart money’ reputation.
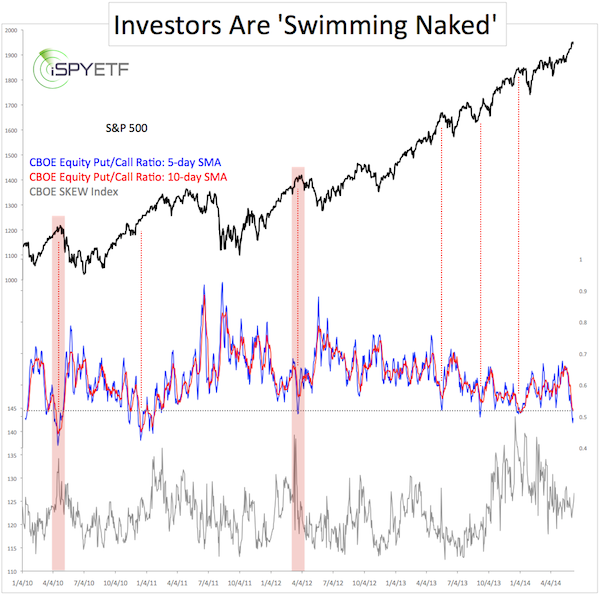
The chart below, featured in the June 11 Profit Radar Report, plots the S&P 500 (SNP: ^GSPC) against the 5-and 10-day SMA of CBOE Equity Put/Call ratio.

As the dashed red lines highlight, low put/call ratio levels led to S&P 500 (NYSEArca: SPY) weakness more often than not.
Is the Put/Call Ratio Warning of a Crash?
Lately, there’s been much talk about a crash or major correction. Does the current equity put/call ratio foreshadow such a crash or correction?
Looking at the put/call ratio in isolation one could conclude that there’s a high chance of a 1%+ correction. Why?
Similar equity put/call ratio readings in April 2010 and April 2012 were followed by nasty sell offs (see red shadows).
But let’s expand our analysis to include the CBOE SKEW Index. The SKEW Index basically estimates the probability of a large decline (2 standard deviations or ‘Black Swan’ event).
Readings of 135+ suggest a 12% chance of a large decline. Readings of 115 or less suggest a 6% chance of a large decline. In short, the higher the SKEW, the greater the risk for stocks.
Last week the SKEW finished at 127.78, which is above average, but well below its January peak of 139.62.
The April 2010 and April 2012 highs saw SKEW readings of 134 and 139 (shaded areas).
The relative SKEW anemia softens the generally bearish message of the put/call ratio, but it doesn’t eliminate all the risk.
The Profit Radar Report’s 2014 S&P 500 Forecast (published on January 15), projected a pre-summer high at S&P 1,950. Last week the S&P reached 1,950 and pulled back. What does this mean for the rest of the year?
A complimentary look at the updated 2014 S&P 500 Forecast is available here:
Simon Maierhofer is the publisher of the Profit Radar Report. The Profit Radar Report presents complex market analysis (S&P 500, Dow Jones, gold, silver, euro and bonds) in an easy format. Technical analysis, sentiment indicators, seasonal patterns and common sense are all wrapped up into two or more easy-to-read weekly updates. All Profit Radar Report recommendations resulted in a 59.51% net gain in 2013.
Follow Simon on Twitter @ iSPYETF or sign up for the FREE iSPYETF Newsletter to get actionable ETF trade ideas delivered for free.
