Never mind which company Bill Gross is working at this week. The talking heads on Wall Street have been ranting about the bursting of the bond market’s bubble for years and it’s getting old. They did it in 2009. They did it in 2010. They did it in 2011. They did it in 2012. They did it in 2013. And they’re doing it again in 2014.
At the start of this year, a poll of 72 Wall Street economists confidently predicted the bond bubble’s end was imminent. Were they right?
(AUDIO) Pass or Fail? Ron does a Portfolio Report Card on a $200,000 Retirement Plan
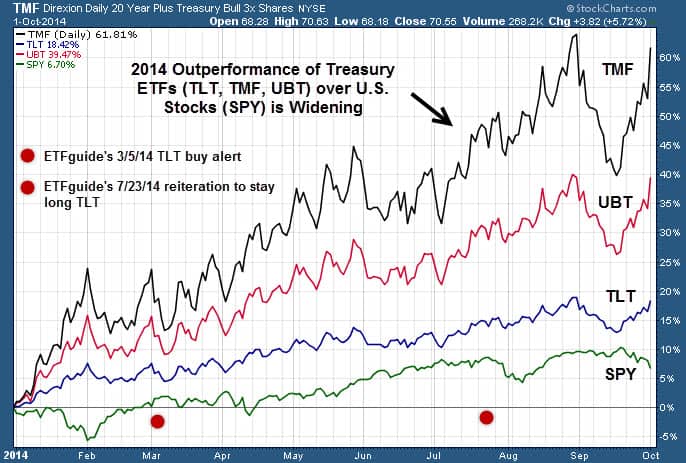
The chart below plots the year-to-date performance of the S&P 500 (SNP:^GSPC) against an assortment of long-term U.S. Treasury ETFs. In every case, the gap of outperformance by long-term U.S. Treasuries versus U.S. stocks (NYSEARCA:DIA) continues to widen. If this is your definition of a bond market collapse, go back to sleep.
The ETFs being charted are the iShares 20+ Yr. Treasury Bond ETF (NYSEARCA:TLT) and the 2x daily leveraged ProShares Ultra 20+ Yr. U.S. Treasury ETF (NYSEARCA:UBT) and the 3x daily Direxion Daily 20+ Yr. Treasury Bull 3x Shares (NYSEARCA:TMF). As you can see, TLT, UBT, and TMF are all killing SPY’s YTD performance by double digits.
The above chart also shows our actionable timestamped alerts given to ETFguide’s readers for capitalizing on the trend of higher bond prices and lower yields. Not only have we been right, but we’ve been saying the exact opposite of Wall Street’s chart challenged throngs. The only bubbles Wall Street sees are the bubbles in its champagne glasses!
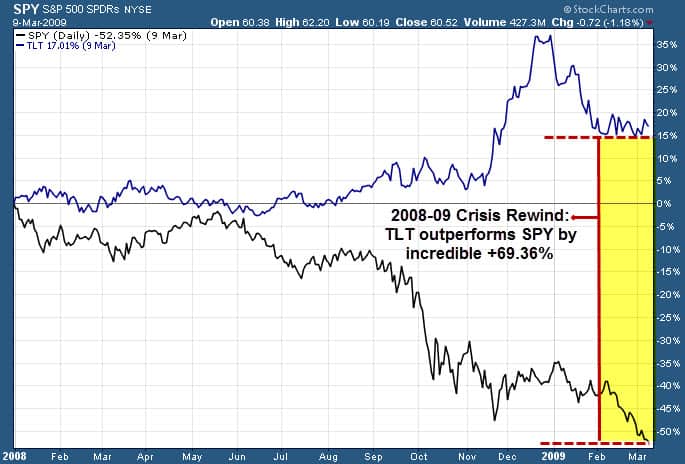
For historical perspective, our next chart shows the performance of long-term U.S. Treasuries versus the S&P 500 during the 2008-09 financial crisis. The future is never like the past, but sometimes it rhymes.
Don’t miss our latest volatility alert (ChicagoOptions:^VIX) which is now +81% and still open. By the way, since July 1, the VIX is +49% while the S&P 500 (NYSEARCA:IVV) is -0.90%. Who says buying depressed assets doesn’t work anymore?
The ETF Profit Strategy Newsletter uses technical analysis, market history along with common sense to keep investors on the right side of the market. Our largest year-to-date winner is a +188% timestamped gain from our Jun. 5 Weekly Picks. All readers get email and text alerts too.
Follow us on Twitter @ ETFguide

