361.9%.
That’s how much Draftkings returned in its first year of trading.
The same year they doubled their annual losses.
Since their high in March, price cratered over 20%.
But all may not be lost.
Our chart analysis shows the current price level could be a great entry point.
And we want to walk you through our thought process and the details.
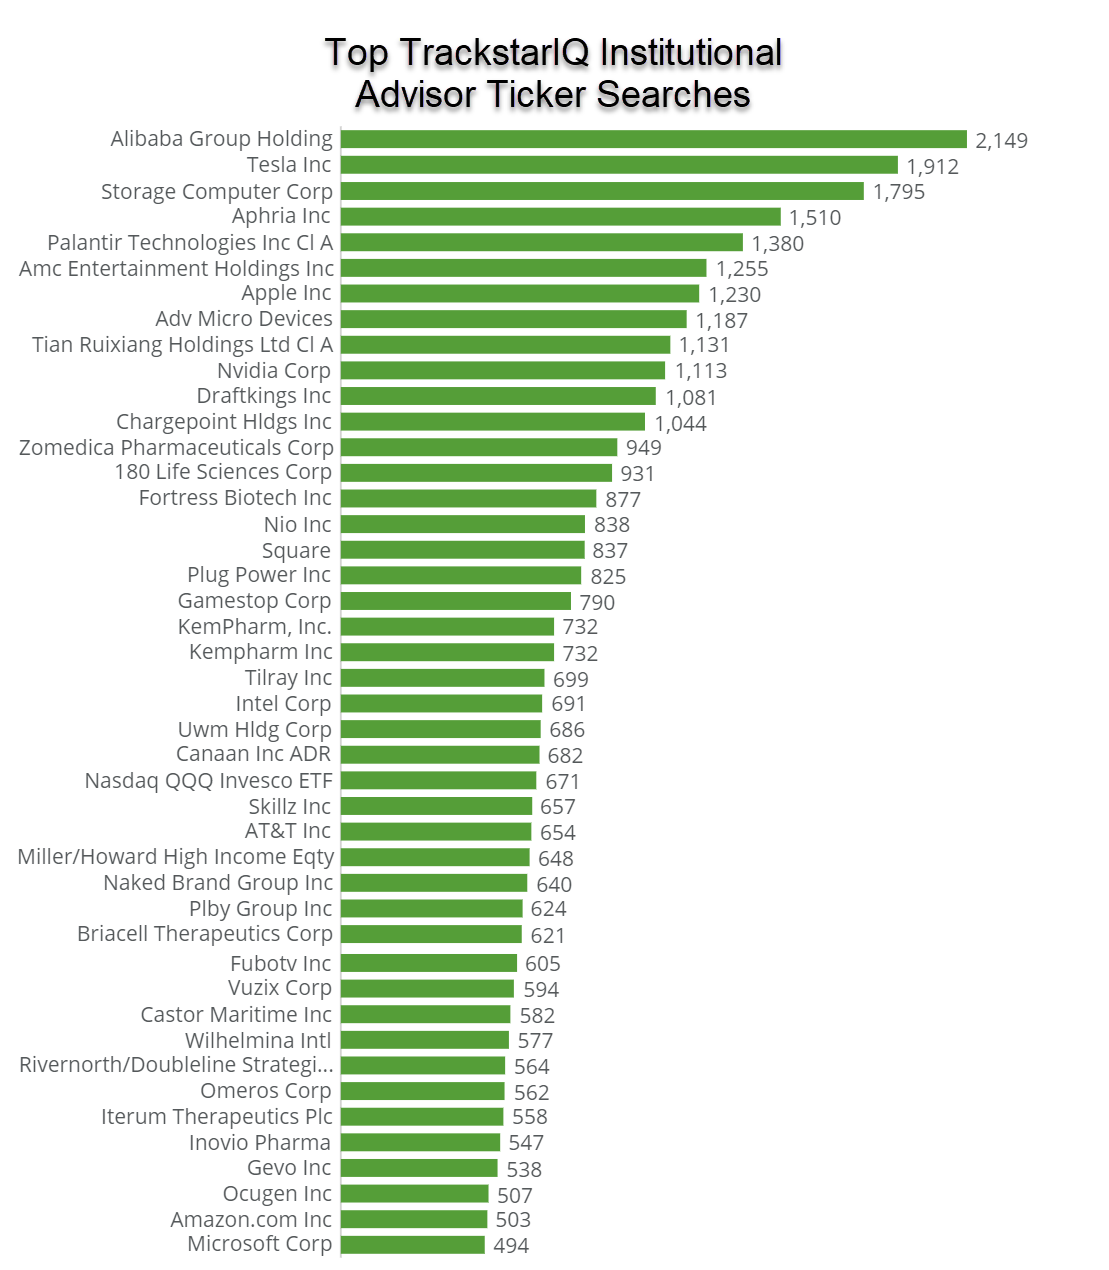
Because interest in the stock is growing according to our TrackstarIQ Data.
It ranked one of our top searches in the last three weeks.
And when we analyzed the chart, we found three (total coincidence) technical reasons that price may find support here.
- Fibonacci retracement
- Exponential moving average
- Trendline
All three of these converge at the SAME area.
Today’s email will cover the first part of this analysis, with each subsequent day adding another layer.
Take a look at our analysis and see if you agree.
Fibonnaci retracement
Chart traders love to use Fibonacci analysis. It’s a fantastic way to derive support and resistance levels (places where price stops dead in its tracks).
You might remember something like this from school:
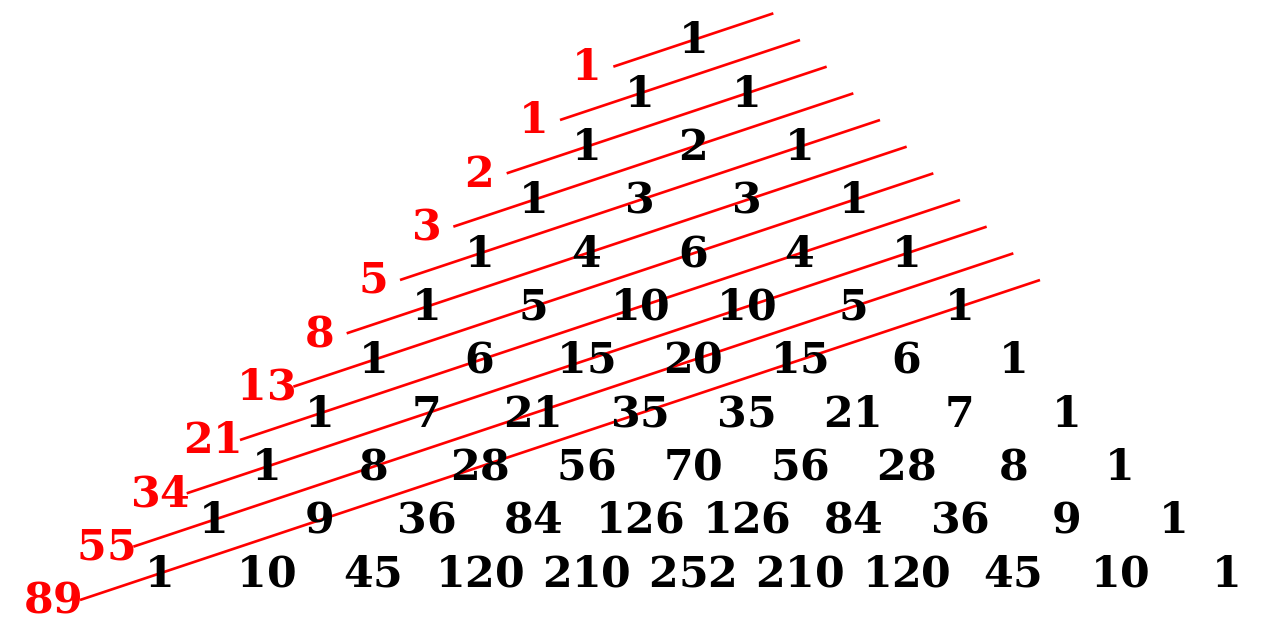
That Pascal’s triangle. You add the adjacent numbers of the previous line.
IE: 3+3 = 6.
Without getting into the nitty-gritty, you can add up the lines as shown in red to get Fibonacci numbers.
When you divide one number by the next, you get a percentage.
IE: 55/89=61.8
You can also skip a number to divide 34 into 89 etc.
Eventually, you’ll get the following sequence of results:
23.6,38.2, and 61.8.
These form the basis of a Fibonacci retracement.
People also add in 50% as a retracement. It’s not a Fibonacci number, but halfway is sort of accepted.
Chart analysts draw Fibonacci retracements by taking the highest and lowest points that create ‘points’ on the chart, known as swing points. They’re typically obvious places where a price trend reversed.
Here’s how it looks in the DKNG chart.
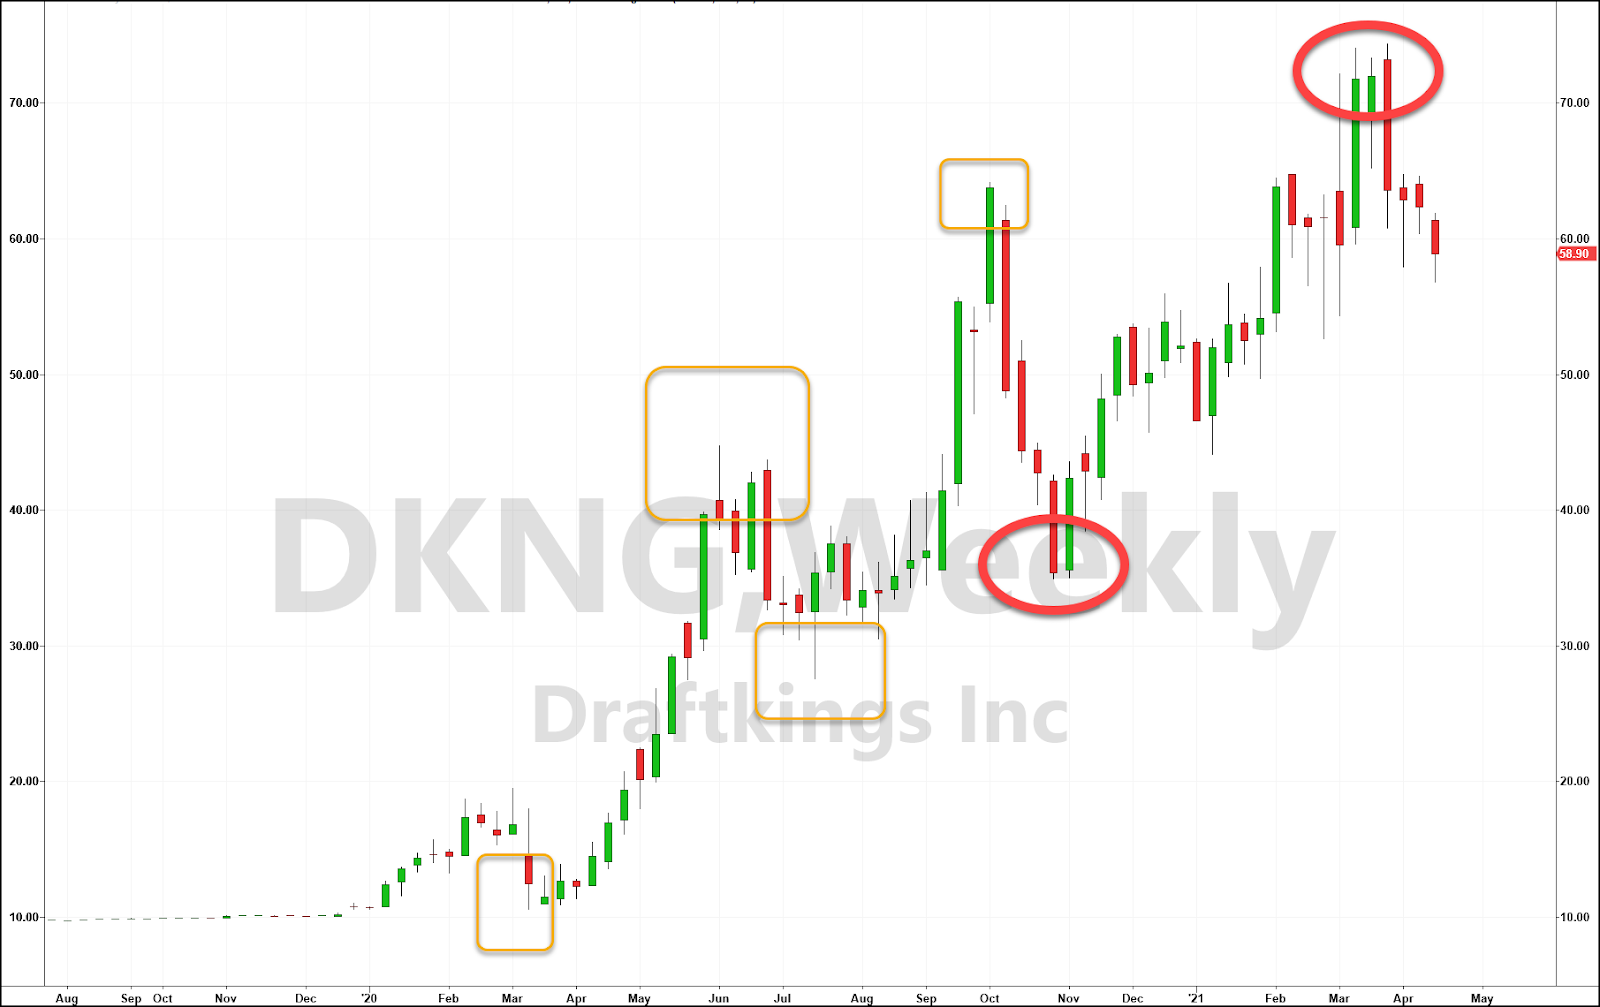
The orange blocks note previous swing points. Red circles identify the most recent swing points that we used for this analysis.
What we’re to do is take the prices in the red circles and define percentage retracements that correspond to the Fibonacci numbers.
Here’s what it would look like.
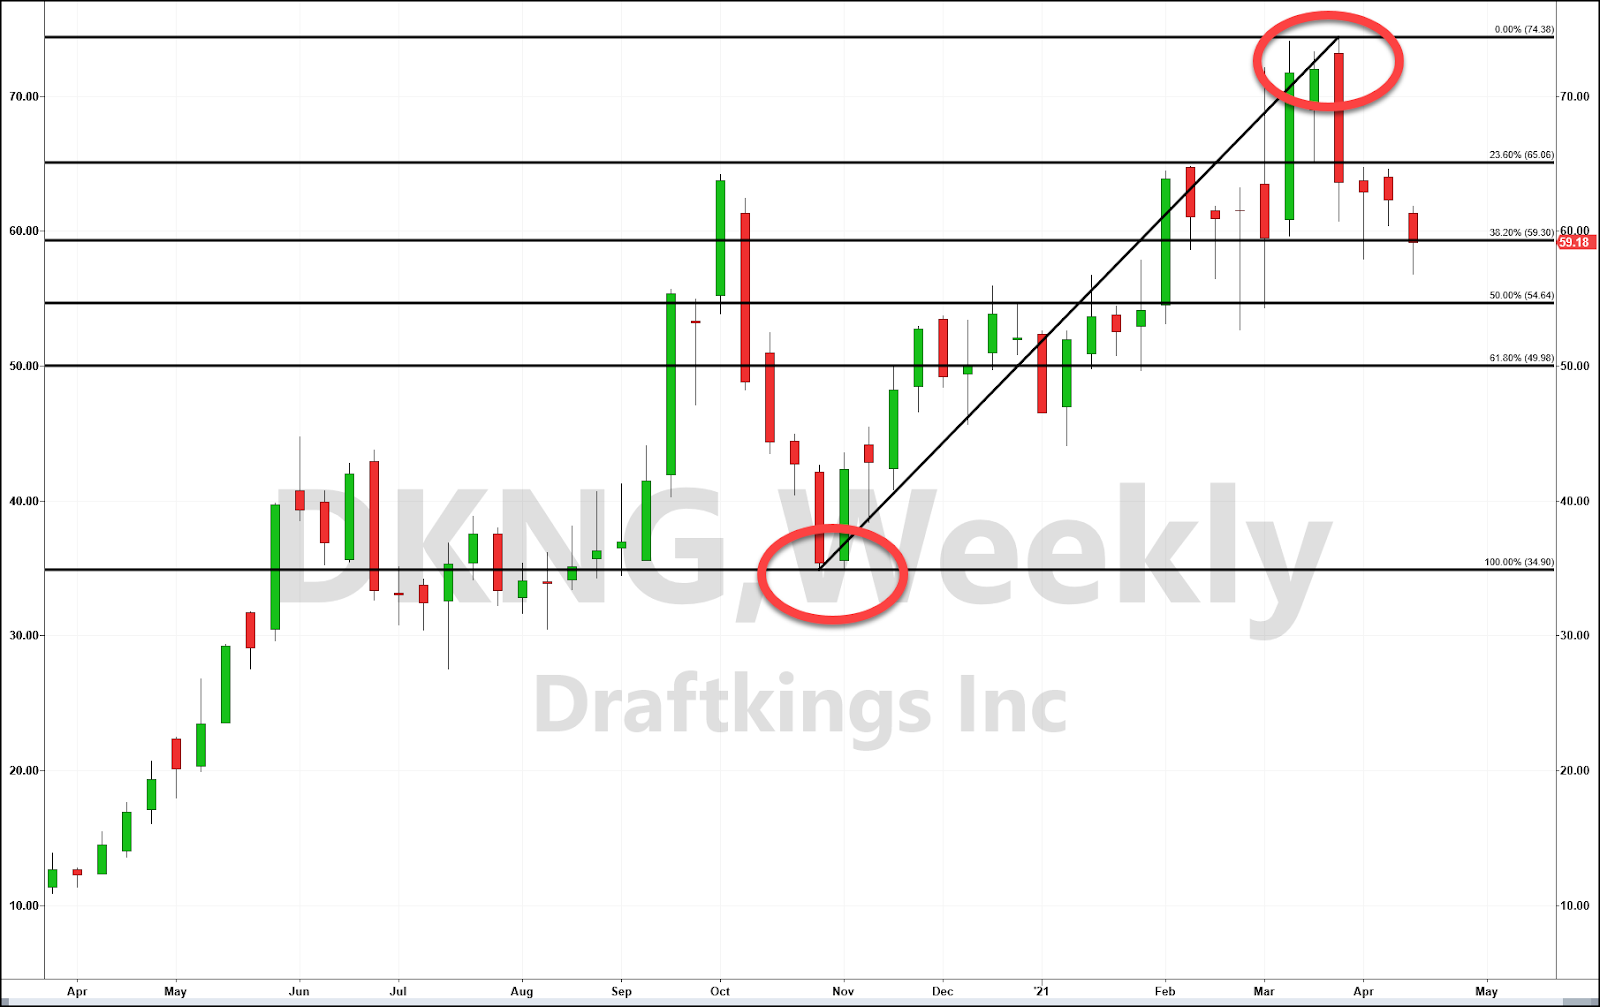
You can see how price found support several weeks ago around the 38.2% retracement or right around $60.
Now, this price level may not hold up this go around.
But you can use this analysis to locate other potential areas of support in the stock.
One way to hedge your bets is to take a small position, say 1/3rd of your normal size. You could then add 1/3rd at the 50% retracement level and another 1/3rd at the 61.8% retracement level.
Stay tuned for part two of our analysis tomorrow.