Advisor Perspectives’ Doug Short recently published an update on margin debt which includes several well-done charts. But it only takes one to make the point.
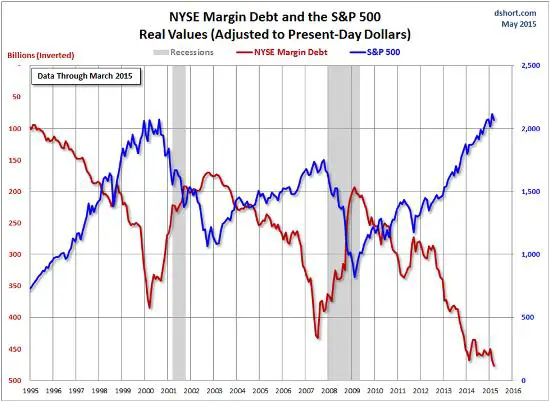
See below for the relationship between margin debt — money borrowed by retail investors against their stocks and used to buy more stock — where Short has enhanced the visual impact by inverting the margin debt line. As presented here, a downward sloping red line means margin debt is increasing. So when the two lines diverge, that means stock prices and margin debt are both rising.
The gap between them is thus a measure of the divergence between investor expectations and market reality. Note two things: 1) When the gap grows too large, the lines tend to converge via falling stock prices and shrinking margin debt (usually through involuntary liquidation of leveraged stock portfolios). And 2) Today the gap is wider than it’s ever been. If history is a valid guide, the two lines will shortly cross somewhere around 1,000 on the S&P, or about 50% lower than current levels.