Our initial look at the quantity theory was very positive. Over long periods of time the growth rates of M and P are highly correlated, in a sample that includes high inflation countries. Even better, some of the discrepancy is explained by growth in real GDP. And better still, the coefficient on RGDP growth was approximately negative one. Let’s use an example to think about what that means.
Suppose a country has 40%/year money growth. Your first guess might be 40% inflation. But now you find out that RGDP growth was 5%/year. Now your best guess for inflation is 35%, as RGDP growth seems to reduce inflation roughly one for one. OK, but then why not simplify the model by using NGDP as our scale variable instead of prices? Instead of going:
inflation = money growth – RGDP growth + other stuff
We could have:
NGDP growth = money growth + other stuff
I had Patrick Horan do a simple regression of NGDP growth on money growth, and this is what he got:
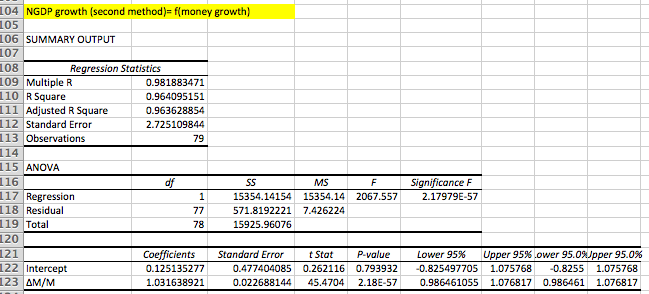
The adjusted R2 is better than for a simple regression of inflation on money growth, and almost exactly the same as when we regressed inflation on both money growth and real GDP growth (in the previous two posts.)
Let’s think a bit more about real money demand:
M/P = f(RGDP, other stuff)
The real GDP factor is obvious. People have more demand for real cash balances as they get richer, and make more purchases. That addresses the benefit of holding cash. But what about the cost? There are several ways of thinking about the opportunity cost of holding cash, such as inflation and nominal interest rates. Inflation is the loss of purchasing power from holding cash and nominal interest rates are the foregone earnings from putting that wealth into an alternative asset. Fortunately, the Fisher Effect suggests these two variables will be highly correlated when inflation is extremely high. So the “other stuff” could be proxied by either the inflation rate, or (better yet in my view) the nominal interest rate.
But real money demand assumes that the price level is the right scale variable. If we shift over to NGDP, we get the following:
M/NGDP = f(i) = Cambridge K
or
NGDP/M = V(i) = Velocity
In the data set of 79 countries (in this post) there were 12 cases where inflation was higher than the money supply growth. In each case, real GDP growth was positive. This meant that in those 12 cases the velocity of circulation grew faster than RGDP over a period of 30 or 40 years. That’s actually pretty impressive, as most countries see considerable RGDP growth over 40 years. If velocity grew even faster, then those 12 cases exhibit a pretty large total increase in V, which is a violation of the simple QTM assumption that velocity is stable.
Let’s suppose our models of money demand are correct. What would it take for velocity to increase sharply? The demand for money would have to decline sharply. And that is mostly likely to be caused by a big increase in the opportunity cost of holding money. So you’d expect to see a big rise in V in countries where the inflation rate/nominal interest rate increased very sharply. Unfortunately the table doesn’t show the change in the inflation rate, just the average level. But think about it, if the inflation rate rose very dramatically over that period, isn’t it likely that the average inflation rate would be rather high? Not certain, but fairly likely. You normally won’t see the inflation rate increase by 20% or 40% in countries like Switzerland and Germany, where the average rate of inflation was only about 3%.
The preceding view of money demand suggests that there should only be a few countries where inflation exceeded average money growth over 30 or 40 years, and that most of those cases would be countries where the average inflation rate is quite high. And that’s exactly what we observe. There are only 12 such countries out of 79, and yet they comprise 8 of the top 14 inflation rates.
So now we have our complete money supply model:
M/P = f(RGDP, i)
and delta M/P = delta Y – V(i)
Or to make the model even simpler:
NGDP/M = V(i)
And:
delta NGDP = delta M + delta V(i)
Nominal GDP growth depends on two factors, money base growth plus the change in velocity. And velocity is a function of the nominal interest rate.
This means that when the inflation rate rises very sharply, inflation will often be even higher than the money growth rate. But that’s not really a big problem for the quantity theory of money. No one gets too upset if Argentina has 73% money growth and 76% inflation. The problems come in the other directions, and for two reasons:
1. When inflation slows, money growth is often higher than inflation, and sometimes even higher than before inflation slowed, for a brief period when there is a one-time adjustment in real cash balances. That looks bad for the QTM. This occurred briefly in the early 1980s, when inflation slowed from 13% to 4%, and the public then chose to hold larger real cash balances (and velocity fell.) At low rates of inflation these discrepancy stand out more, and tend to discredit the entire QTM approach.
2. This problem becomes especially severe at near zero interest rates. Recall that base money is the world’s most liquid asset. It has some really appealing qualities. When interest rates fall to zero you are reducing the opportunity cost of holding this desirable asset all the way to zero. So there can be enormous increases in base money demand. This problem can also occur if the central bank foolishly chooses to pay market interest rates on bank reserves.
To summarize, at the zero bound the demand for base money can soar, and the money supply growth rate can vastly exceed the inflation and NGDP growth rates. This is where the QTM looks worst.
But even in this case, money is what drives inflation and NGDP. If the liquidity trap lasts forever then bonds become money, and the money supply gets redefined to include bonds. In the far more realistic case where the liquidity trap is expected to be temporary, long term rate stay above zero, and permanent monetary injections still boost the price level and NGDP according to the QTM.
So far I’ve focused on exogenous changes in the money supply, which is the model that works best for the high inflation cases. The next post will examine monetary regimes like Bretton Woods and the Taylor rule, where the money supply is endogenous. We will see that the correlation between money and prices greatly weakens, despite the fact that changes in the money supply still cause in one for one changes in P and NGDP.