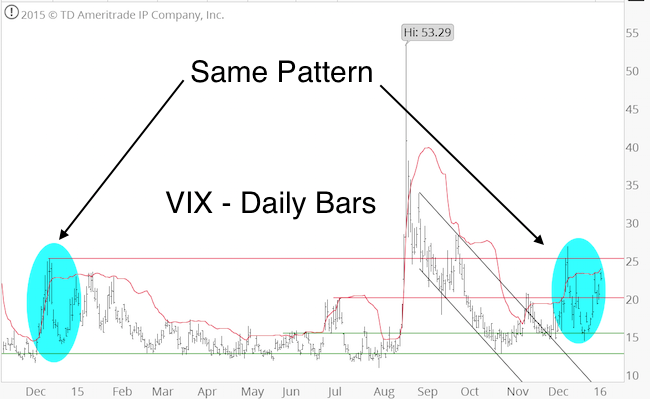
The December 13, 2015 Profit Radar Report first suggested that the VIX is following a pattern last seen in December 2014.
The blue circles below highlight this correlation.

The December 27, 2015 Profit Radar Report again referred to this correlation, and stated that: “The VIX painted a potential reversal candle and is likely to chop higher.”
The notion of a rising VIX was confirmed by VIX seasonality and the VIX/VXV ratio.
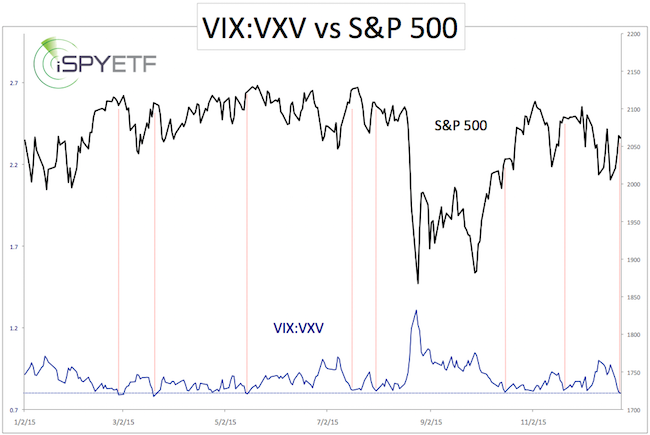
The December 27 update also featured this VIX/VXV chart and commentary:

“The VIX/VXV ratio is at the bottom of its 2015 range. The VIX measures expected 1-month volatility, VXV measures expected 3-month volatility. The current VIX/VXV ratio reflects more long-term fear than short-term fear, which ironically tends to leads to increased short-term volatility (and lower S&P 500 prices) more often than not.”
The VIX is up 48% since and is now testing the upper Bollinger Band (red line) like it did on January 7, 2015. A move to the UPP generally means the move is stretched, at least short-term.
Simon Maierhofer is the publisher of the Profit Radar Report. The Profit Radar Report presents complex market analysis (S&P 500, Dow Jones, gold, silver, euro and bonds) in an easy format. Technical analysis, sentiment indicators, seasonal patterns and common sense are all wrapped up into two or more easy-to-read weekly updates. All Profit Radar Report recommendations resulted in a 59.51% net gain in 2013 and 17.59% in 2014.
Follow Simon on Twitter @ iSPYETF or sign up for the FREE iSPYETF Newsletter to get actionable ETF trade ideas delivered for free.
