The following research is an excerpt from the February 21 Profit Radar Report:
After touching 1,810 on February 11, the S&P 500 rallied three consecutive days, each day gaining more than 1.5% (see chart). Historically, this can be considered a ‘kickoff’ rally. How so?
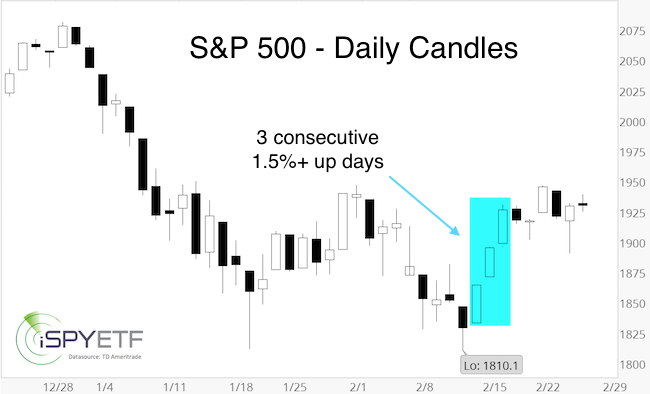
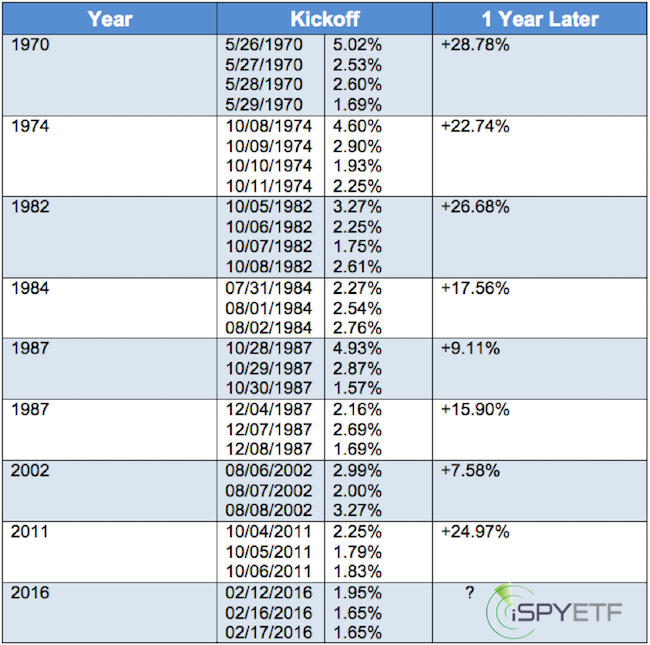
Since 1970, the S&P gained more than 1.5% three days in a row only eight other times.
Every single time, the S&P 500 traded higher a year later (average gain: 19.16%, calculated after the last day of the kickoff sequence). The table below lists all occurrences.
The charts below provide a snapshot of each time this happened. The dashed green line marks the kickoff move. For context, each chart includes 60 trading days (about 3 months) before the kickoff rally, and 255 trading days (above 1 year) after.
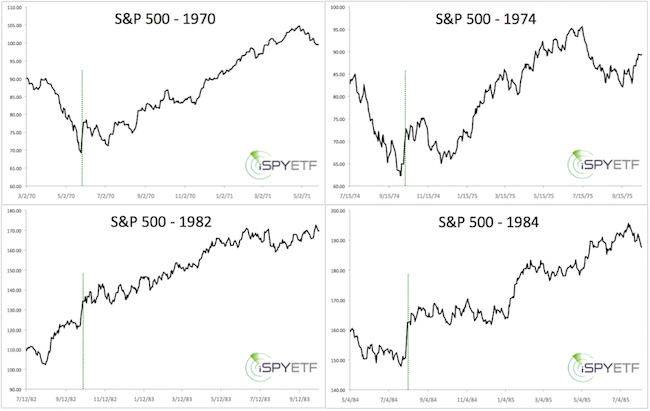
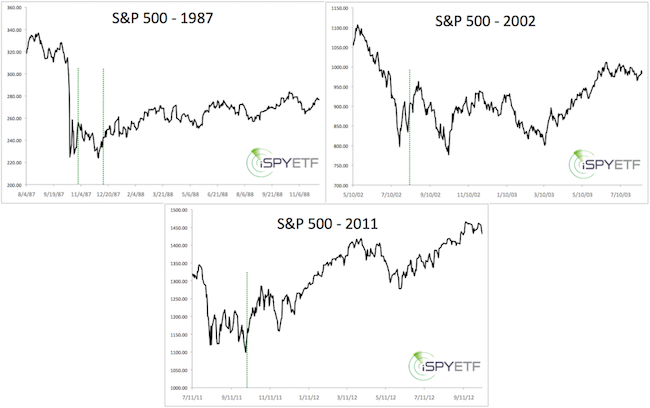
When viewed in isolation, the implications of the February kickoff are indisputably bullish. Here are a few more nuances:
- Like in 2016, the S&P 500 closed at a 52-week low just before the kickoff rally in 1970, 1987 (December), and 2011.
- Four of the nine kickoff moves occurred in October, emphasizing October’s reputation as bear market killer.
- The S&P 500 violated the low set prior to the kickoff move only twice (1987, 2002). This second lower low marked the end of the decline both times.
If you enjoy quality, hand-crafted research, >> Sign up for the FREE iSPYETF Newsletter
Reconciling Indicators
This pattern of post-kickoff performance is particularly of interest, because it harmonizes with the outlook published in the February 10 Profit Radar Report, which expected: “A drop towards or just below 1,812, followed by a rally just above 1,950 and a ‘better bottom, likely below 1,800″.
The February 10 Profit Radar Report visually illustrated this outlook via the solid yellow projection shown below. The solid yellow projection replaced the dashed yellow projection, initially published on January 24 (see here for more details).
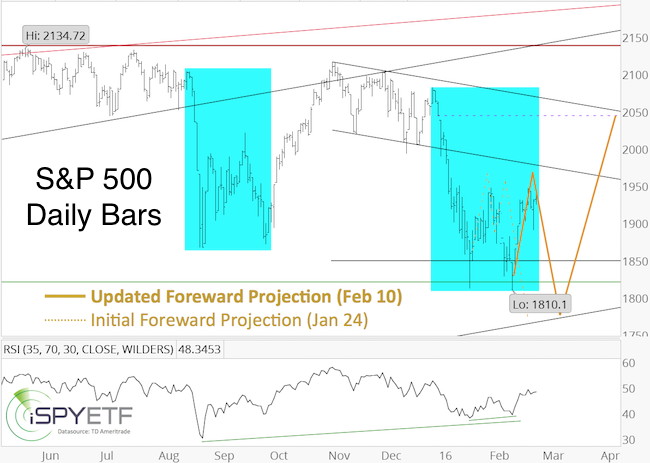
The S&P dropped ‘just below 1,812’ the next day (1,810.1 on February 11), and rallied as high as 1,946 (the Profit Radar Report recommended to buy at S&P 1,828 or SPY 183 on February 11).
As the solid yellow projection shows, the S&P almost reached our 1,950+ target area, which increased the odds of a pullback. Although the yellow line projects new lows, the S&P’s refusal to budge much may indicate further strength without a major selloff (6 of the 8 kickoff rallies analyzed above did not break the prior low).
At this point, we will just have to wait and see how the S&P reacts. But regardless of what happens the next few days, the buy signal at 1,828 got us in early, and gives us the luxury to manage profits instead of worrying about missing a runaway rally.
With or without break below 1,810, purely based on the post-kickoff pattern, the remainder of the year looks overall bullish. Of course, the bullish kickoff rally is tempered by the fact that our major market top indicator went off in May 2015, which increased the risk of an upcoming bear market. More details on the major market top signal is available here.
A comprehensive analysis of all pertinent indicators (liquidity, sentiment, technicals, historic patterns, cycles & seasonality, Elliott Wave Theory, etc) along with a projection for the entire year is available via the 2016 S&P 500 Forecast (available to subscribers of the Profit Radar Report).
Simon Maierhofer is the publisher of the Profit Radar Report. The Profit Radar Report presents complex market analysis (S&P 500, Dow Jones, gold, silver, euro and bonds) in an easy format. Technical analysis, sentiment indicators, seasonal patterns and common sense are all wrapped up into two or more easy-to-read weekly updates. All Profit Radar Report recommendations resulted in a 59.51% net gain in 2013, 17.59% in 2014, and 24.52% in 2015.
Follow Simon on Twitter @ iSPYETF or sign up for the FREE iSPYETF Newsletter to get actionable ETF trade ideas delivered for free.
