Last week’s update titled “Bears Get Another Shot at Taking Stocks Down” listed four reasons why bears get another shot and two reasons why stocks may continue higher.
This may sound like a contradiction, but it’s actually not. Basically we were looking for a good low-risk opportunity to go short. The higher stocks go, the better the opportunity (as long as you don’t short too early).
The June 1 Profit Radar Report observed some semi-bullish developments and stated that: “Surprises to the up side – to fool the crowded trade – are possible. The market may be tempted to flush out the ‘June pessimists’ first. That’s why we are very careful about initiating our short-trade.”
Barron’s rates the iSPYETF as a “trader with a good track record.” Click here for Barron’s assessment of the Profit Radar Report.
How exactly does being ‘careful about initiating our short-trade’ look like? We use support/resistance levels to our advantage.
The May 24 Profit Radar Report included the following recommendation:
“We will go short if the S&P 500 moves above 2,090 (black trend channel) and subsequently drops below 2,084 (May 10 high). Waiting for a break of momentum (drop from 2,090 to 2,084) against resistance increases the odds of a winning trade. The approximate corresponding level for the ProShares S&P 500 Short ETF (SH) is: A drop below 20 followed by a rise above 20.06.”
The hourly chart below shows why 2,084 was important. A drop back below 2,084 would have triggered our sell, but as the green arrows indicate, the S&P 500 never drop that low. It touched the 2,088 – 2,085 zone four times, but bounced every time.
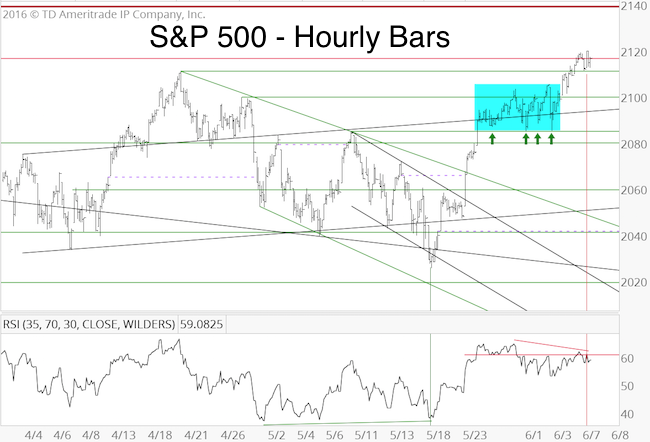
Anticipation of a potential ‘flush the bears spike’ combined with a carefully placed sell trigger kept us in the neutral zone instead of the losing side.
As the S&P 500 continued to rise, we elevated our sell trigger.
The S&P 500 shows a fairly drawn out bearish RSI divergence on the hourly chart, and – unlike the S&P 500 – the Dow Jones has not yet surpassed its April high.
This rally doesn’t have the typical ingredients for a sustained breakout.
Unfortunately there is no particular stopping point. The May 25 Profit Radar Report stated that: “A move to 2,011+/- or 2,034+/- is possible. Due to the market and Elliott Wave Structure at this time, there is no particular ‘make it or break it’ level.”
This trade is not one to be rushed, but unless breadth picks up, odds continue to favor a reversal lower in the not so distant future.
Continued S&P 500 analysis is available via the Profit Radar Report.
Simon Maierhofer is the founder of iSPYETF and the publisher of the Profit Radar Report. Barron’s rated iSPYETF as a “trader with a good track record” (click here for Barron’s profile of the Profit Radar Report). The Profit Radar Report presents complex market analysis (S&P 500, Dow Jones, gold, silver, euro and bonds) in an easy format. Technical analysis, sentiment indicators, seasonal patterns and common sense are all wrapped up into two or more easy-to-read weekly updates. All Profit Radar Report recommendations resulted in a 59.51% net gain in 2013, 17.59% in 2014, and 24.52% in 2015.
Follow Simon on Twitter @ iSPYETF or sign up for the FREE iSPYETF Newsletter to get actionable ETF trade ideas delivered for free.

![]()