The multi-decade Treasury bond bull market reached another all-time high in July.
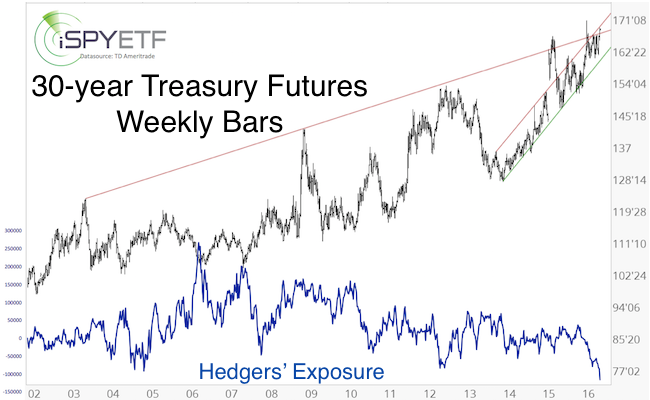
The June 12 Profit Radar Report put 30-year Treasuries bonds on our ‘major market top watch list’ when it published the chart below and stated:
“30-year Treasury futures climbed to a new all-time closing high while commercial hedgers (smart money) have racked up record short exposure. Seasonality is about to hit a weak spot. Bearish RSI divergences exist on various time frames. We will be looking for an opportunity to short 30-year Treasuries.”
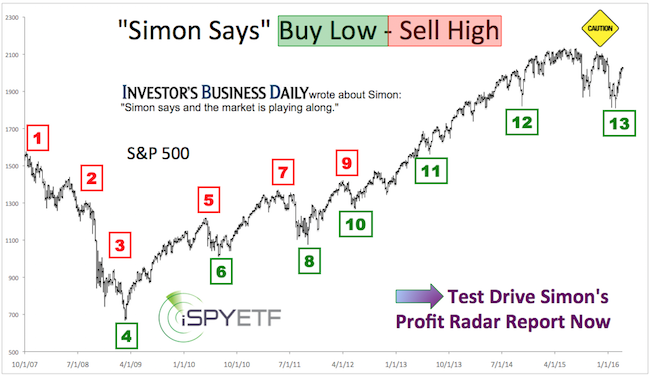
Barron’s rates iSPYETF as “trader with a good track record” and Investor’s Bussines Daily says “When Simon says, the market listens.” Find out why Barron’s and IBD endorse Simon Maierhofer’s Profit Radar Report.
It took a little while for this trade to ‘ripen,’ but the July 27 Profit Radar Report featured this recommendation:
“The July 17 PRR stated that: ‘30-year Treasuries may bounce a bit to perhaps give us a second bite at the cherry.’ This bounce materialized this week, and Treasuries reached one of two targets (173’27 and 175’10) that should lead to a down side reversal.
We will leg into this short 30-year Treasury trade with half a position. Investors can short via futures, short TLT or buy the Short 20+ Year Treasury ETF (TBF). We will likely deploy the second half of this trade if Treasuries rally into the second target.”
Treasuries never rallied to the second bounce target, but instead started stair stepping lower.
We closed the short Treasuries position when trade first touched the 200-day SMA on September 13.
Treasuries started to rally shortly thereafter. This rally brings Treasuries to an inflection point.
Inflection Point
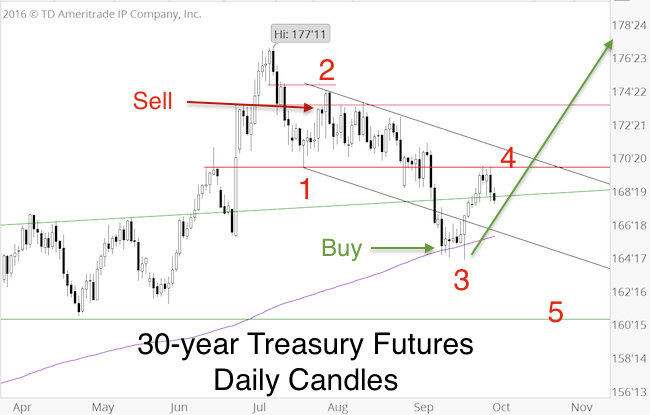
From the July high to the September low, Treasuries seem to have traced out 3 waves (according to Elliott Wave Theory – EWT).
Based on EWT, a 3-wave move is a counter trend move, while a 5-wave move usually marks are trend change (or trend continuation in other cases).
This means that the bounce from the September low is either:
- Wave 4 followed by a wave 5 decline to new lows. This would suggest that the July high is a major top (red number labels).
- The beginning of another rally leg following a complete 3-wave correction (green arrow).
If the rally from the September low is a wave 4, it should stop near the red resistance line or the black trend channel. Some may argue that the rally has gone too far already to be considered a wave 4 bounce.
While this doesn’t remove all ambiguity, the wave counts give traders some helpful directional clues, such as:
- Going short is risky while trade remains above the September low
- Buyers should dial back risk on a drop below the September low
- A move above 170 and 171 should lead to more gains
The Profit Radar Report monitors dozens of indicators to identify low-risk or high probability setups for various asset classes.
Simon Maierhofer is the founder of iSPYETF and the publisher of the Profit Radar Report. Barron’s rated iSPYETF as a “trader with a good track record” (click here for Barron’s profile of the Profit Radar Report). The Profit Radar Report presents complex market analysis (S&P 500, Dow Jones, gold, silver, euro and bonds) in an easy format. Technical analysis, sentiment indicators, seasonal patterns and common sense are all wrapped up into two or more easy-to-read weekly updates. All Profit Radar Report recommendations resulted in a 59.51% net gain in 2013, 17.59% in 2014, and 24.52% in 2015.
Follow Simon on Twitter @ iSPYETF or sign up for the FREE iSPYETF Newsletter to get actionable ETF trade ideas delivered for free.

![]()