Two days ago I posted some questions for next year: Ten Economic Questions for 2017. I’ll try to add some thoughts, and maybe some predictions for each question.
8) Residential Investment: Residential investment (RI) was sluggish in 2016, although new home sales were up solidly. Note: RI is mostly investment in new single family structures, multifamily structures, home improvement and commissions on existing home sales. How much will RI increase in 2017? How about housing starts and new home sales in 2017?
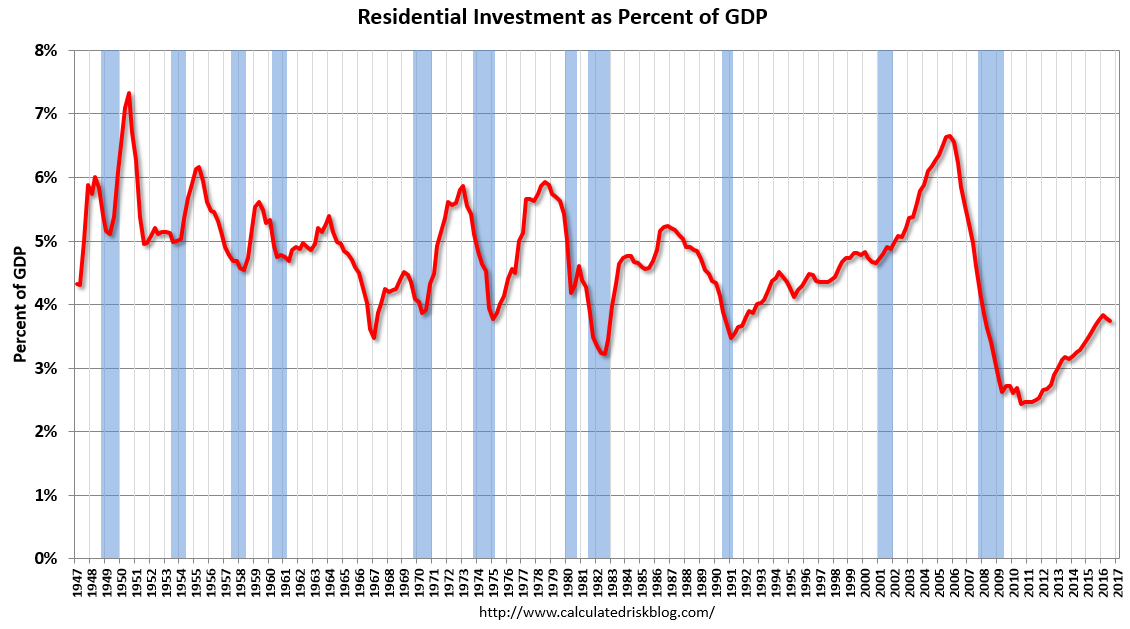
First a graph of RI as a percent of Gross Domestic Product (GDP) through Q3 2016.
 Click on graph for larger image.
Usually residential investment is a strong contributor to GDP growth and employment in the early stages of a recovery, but not this time – and that weakness was a key reason why the recovery was sluggish. Residential investment finally turned positive during 2011 and made a solid positive contribution to GDP every year since then.
RI as a percent of GDP is still very low – close to the lows of previous recessions – and was sluggish in 2016.
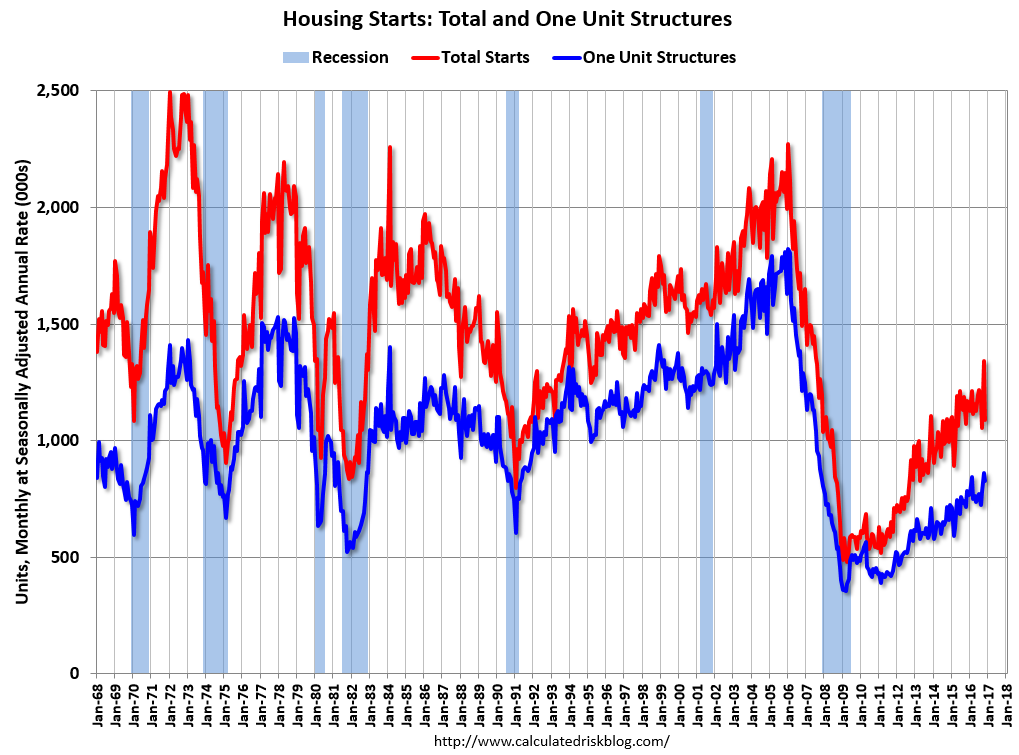 The second graph shows total and single family housing starts through November 2016.
Housing starts are on pace to increase close to 5% in 2016. And even after the significant increase over the last four years, the approximately 1.16 million housing starts in 2016 will still be the 13th lowest on an annual basis since the Census Bureau started tracking starts in 1959 (the seven lowest years were 2008 through 2014). The other lower years were the bottoms of previous recessions.
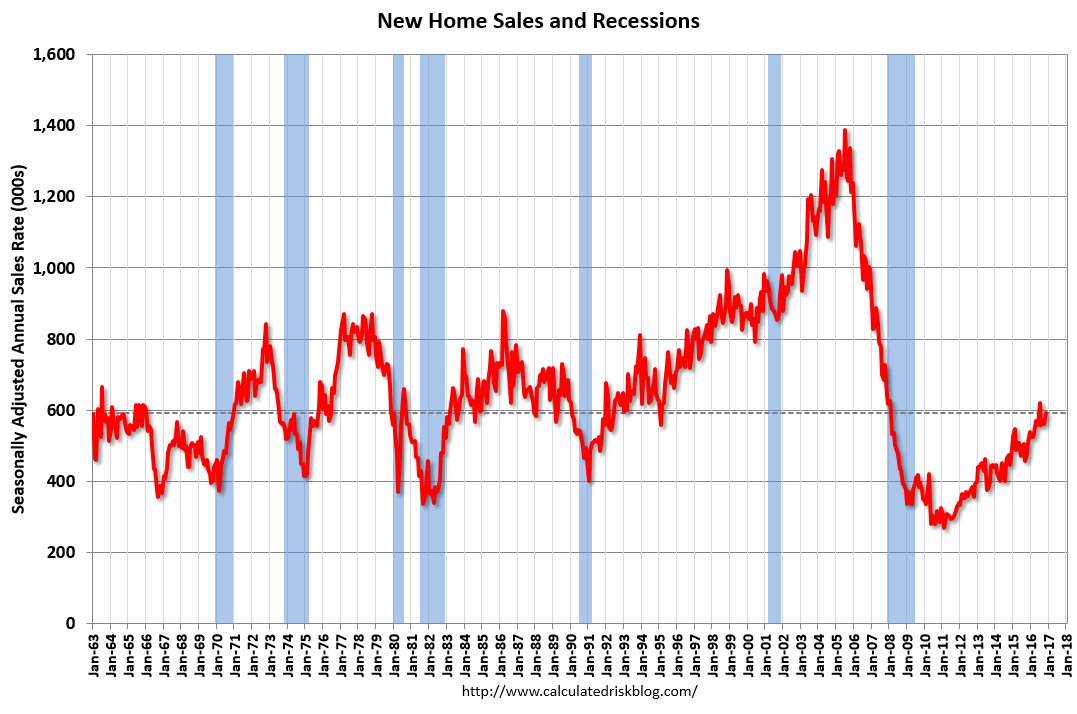 The third graph shows New Home Sales since 1963 through November 2016. The dashed line is the current sales rate.
New home sales in 2016 were up about 12% compared to 2015 at close to 560 thousand.
Here is a table showing housing starts and new home sales over the last decade. No one should expect an increase to 2005 levels, however demographics and household formation suggest starts will return to close to the 1.5 million per year average from 1959 through 2000. That would suggest starts would increase close to 30% over the next few years from the 2016 level.
| Housing Starts and New Home Sales (000s) | ||||
|---|---|---|---|---|
| Housing Starts |
Change | New Home Sales |
Change | |
| 2005 | 2068 | — | 1,283 | — |
| 2006 | 1801 | -12.9% | 1,051 | -18.1% |
| 2007 | 1355 | -24.8% | 776 | -26.2% |
| 2008 | 906 | -33.2% | 485 | -37.5% |
| 2009 | 554 | -38.8% | 375 | -22.7% |
| 2010 | 587 | 5.9% | 323 | -13.9% |
| 2011 | 609 | 3.7% | 306 | -5.3% |
| 2012 | 781 | 28.2% | 368 | 20.3% |
| 2013 | 925 | 18.5% | 429 | 16.6% |
| 2014 | 1003 | 8.5% | 437 | 1.9% |
| 2015 | 1112 | 10.9% | 501 | 14.7% |
| 20161 | 1163 | 4.6% | 562 | 12.2% |
| 12016 estimated | ||||
Most analysts are looking for starts to increase to around 1.25 million in 2017, and for new home sales of around 600 to 650 thousand. This would be an increase of around 7% for starts and maybe 10% for new home sales.
I think there will be further growth in 2017, but I think a combination of higher mortgage rates, less multi-family starts, and not enough lots for low-to-mid range new homes will mean sluggish growth in 2017.
My guess is starts will increase to just over 1.2 million in 2017 and new home sales will be in the low 600 thousand range.