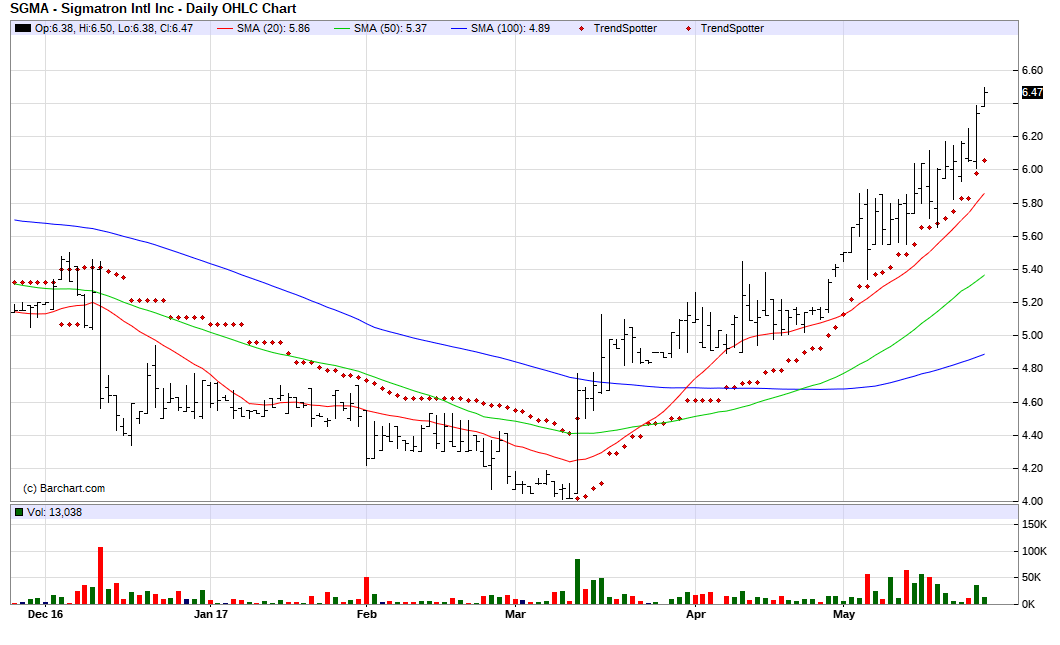
The Chart of the Day belongs to SigmaTron International (SGMA). I found the electronic products by using Barchart to sort today’s Top Stocks to Own list first for the most frequent number of new highs in the last month, then again for technical buy signals of 80% or more. Since the Trend Spotter signaled a buy in 3/14 the stock gained 40.04%.
SigmaTron International Inc. is an independent provider of electronic manufacturing services, which includes printed circuit board assemblies and completely assembled electronic products. Included among the wide range of services the company offers its customers are automatic and manual assembly and testing of products, material sourcing and procurement, design, manufacturing and test engineering support, warehousing and shipment services, and assistance in obtaining product approvals from governmental and other regulatory bodies.
The status of Barchart’s Opinion trading systems are listed below. Please note that the Barchart Opinion indicators are updated live during the session every 10 minutes and can therefore change during the day as the market fluctuates. The indicator numbers shown below therefore may not match what you see live on the Barchart.com web site when you read this report.
Barchart technical indicators;
- 100% technical buy signals
- Trend Spotter buy signal
- Above its 20, 50 and 100 day moving averages
- 15 new highs and up 25.63% in the last month
- Relative Strength Index 73.55%
- Technical support level 6.40
- Recently traded at 6.47 with a 50 day moving average of 25.63
- Market Cap $26.57 million
- P/E 151.50
- No analysts presently following this stock
Quotes and Charts
Quote
Detailed Quote
Chart
Technical Analysis
Technicals Summary
Trader’s Cheat Sheet
Barchart Opinions
Barchart Opinion
Barchart Snapshot
Trading Strategies
Company Info
Company Profile
Key Statistics
Income Statement-Quarterly
Income Statement-Annual
Balance Sheet-Current
Balance Sheet-Annual
Chart of the Day Archive
View Past Chart of the Day Reports