One of the metrics we’d like to follow is a ratio of house prices to incomes. Unfortunately most income data is released with a significantly lag, and there are always questions about which income data to use (the average total income is skewed by the income of a few people).
And for key measures of house prices – like Case-Shiller – we have indexes, not actually prices.
But we can construct a ratio of the house price indexes to some measure of income.
For this graph I decided to look at house prices and the National Average Wage Index from Social Security.
 Click on graph for larger image.
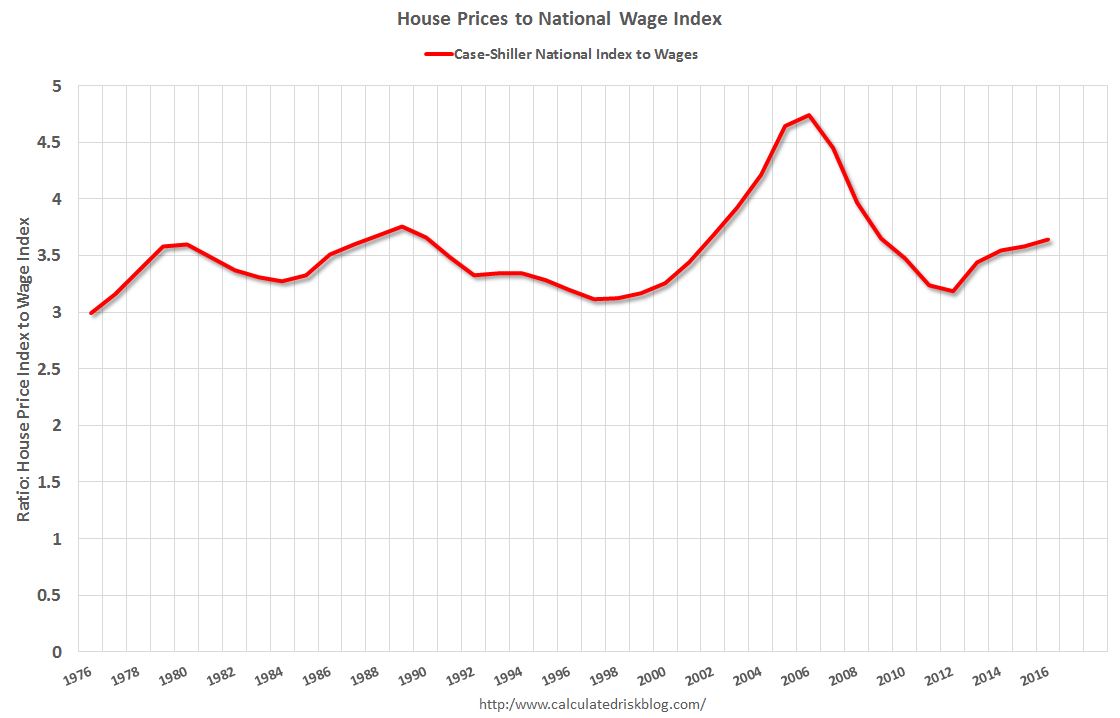
This graph shows the ratio of house price indexes divided by the National Average Wage Index (the Wage index is first divided by 1000).
This uses the annual average National Case-Shiller index since 1976.
As of 2016, house prices were somewhat above the median historical ratio – but far below the bubble peak.
Prices have increased further in 2017, but house prices relative to incomes are still below the 1989 peak (and way below 2006).
Going forward, I think it would be a positive if wages outpaced, or at least kept pace with house prices increases for a few years.
Notes: The national wage index for 2016 is estimated using the same increase as in 2015.