Who would have thought that 2020 will see the S&P 500 drop 32.80% from its all-time high and come within striking distance of recovering all of its losses.
To subscribers of the Profit Radar Report, that’s not big news, because the March 26, 2020 updated stated that: “We anticipate a recovery towards 3,000 (for the S&P 500) over the next couple months and quite possibly new all-time highs in 2020.”
Barron’s rates iSPYETF as “trader with a good track record” and Investor’s Business Daily says: “When Simon says, the market listens.” Find out why Barron’s and IBD endorse Simon Maierhofer’s Profit Radar Report
Now that we are here, its a good time to ask: Would a new S&P 500 all-time high be bullish or bearish?
Historical Parallels
Sunday’s Profit Radar Report included the following study, which provides the best possible answer:
Over the last 50 years, the S&P 500 has lost 30% (or more) and subsequently rallied back within 2% of its prior all-time high 5 other times.
The chart below shows the forward performance of each individual occurrence along with the average forward performance. Here are the key takeaways:
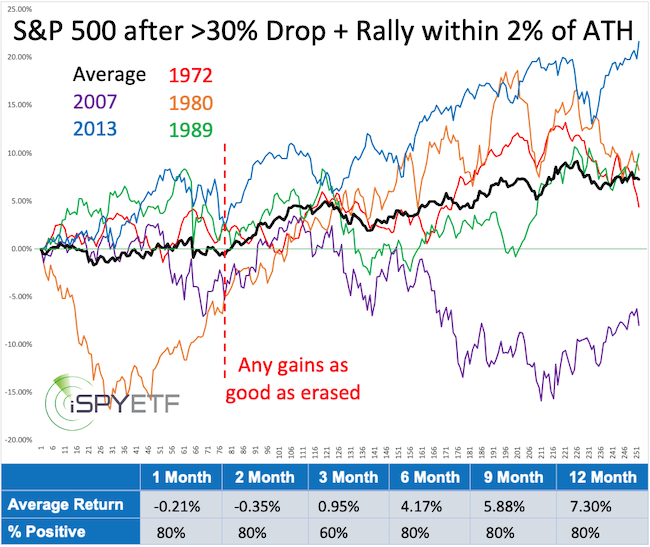
- Only the 1980 rally relapsed immediately
- The 2007 rally eventually turned into a bear market
- Average returns were slightly negative for the first 3-4 months
- Aside from 2008, the S&P 500 traded higher 9 and 12 months later with an average gain of 5.88% and 7.30%
- After 4 months, the S&P 500 was either negative or gave up (most of) its gains every time (dashed red line)
- This study suggests that chasing the breakout doesn’t come with a sustainable reward
- This study has been included in the Risk/Reward Heat Map
Technical Analysis
In terms of technical analysis, the July 20 Profit Radar Report stated the following:
“Price broke out today, but breadth did not confirm, a bi-polar breakout. There are plenty of reasons to view this breakout as suspect, but while 3,220 and 3,190 holds as support, momentum could push price higher, erase the bearish divergences, and target the open chart gap at 3,328.45. Aggressive investors afraid of missing out on any upside may consider going long with a stop-loss below support.”
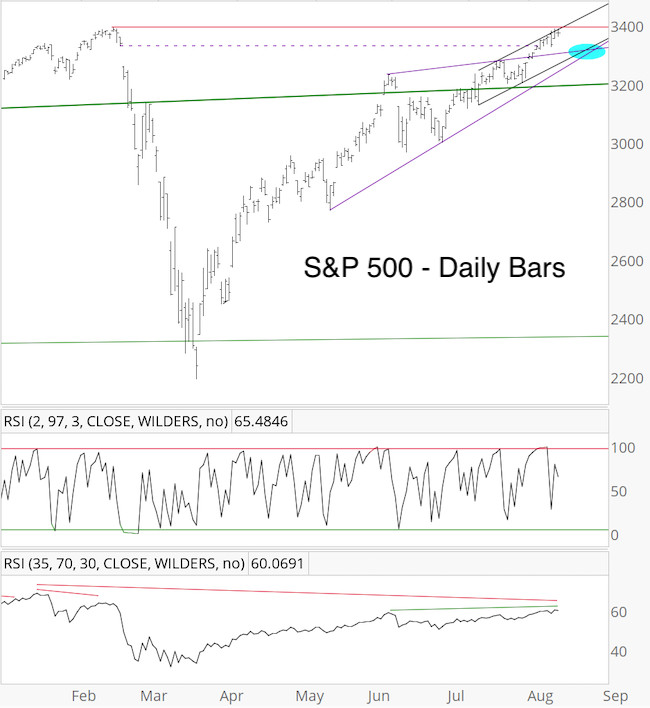
The chart gap (dashed purple line) was closed August 5, but – courtesy of strong up side momentum – price continues to grind higher.
Grinding higher is what momentum markets do … until a nasty pullback brings investors back to reality. Predicting such a rude wakeup call is nearly impossible, but a break below the convergence of support (blue oval) would be a yellow flag.
Continued updates, projections, buy/sell recommendations are available via the Profit Radar Report.
Simon Maierhofer is the founder of iSPYETF and the publisher of the Profit Radar Report. Barron’s rated iSPYETF as a “trader with a good track record” (click here for Barron’s evaluation of the Profit Radar Report). The Profit Radar Report presents complex market analysis (S&P 500, Dow Jones, gold, silver, euro and bonds) in an easy format. Technical analysis, sentiment indicators, seasonal patterns and common sense are all wrapped up into two or more easy-to-read weekly updates. All Profit Radar Report recommendations resulted in a 59.51% net gain in 2013, 17.59% in 2014, 24.52% in 2015, 52.26% in 2016, and 23.39% in 2017.
Follow Simon on Twitter @ iSPYETF or sign up for the FREE iSPYETF e-Newsletter to get actionable ETF trade ideas delivered for free.
