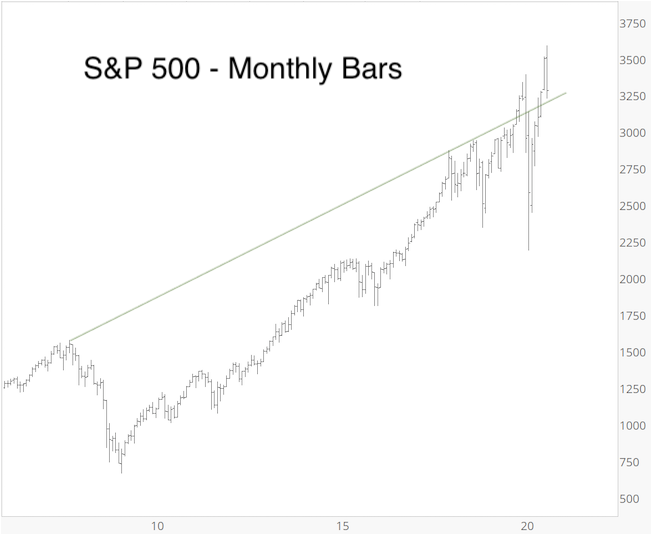
The September 21 Profit Radar Report and September 24 Free Market Outlook (sign up here for free weekly Free Market Outlook e-mail) highlighted the the green S&P 500 support trend line as is was likely to spark a bounce. As the chart below shows, the line is derived by connecting the 2007 and 2018 highs.
Barron’s rates iSPYETF as “trader with a good track record” and Investor’s Business Daily says: “When Simon says, the market listens.” Find out why Barron’s and IBD endorse Simon Maierhofer’s Profit Radar Report

The bounce from trend line support happened, now we get to assess whether stocks will continue higher or relapse yet again.
Mean Reversion & the Sports Illustrated Jinx
The concept of mean reversion wasn’t discovered until the late 1800s (some 200 years after Newton was credited with discovering gravity) and is still misunderstood.
There is a fascinating correlation between mean reversion and the Sports Illustrated (SI) jinx. According to the ‘jinx,’ athletes are jinxed to perform poorly after appearing on the magazine’s cover. There’s a simple explanation for the so called jinx:
To make it on the SI cover, an athlete (or team of athletes) must have performed exceptionally well for a period of time. Appearing on the cover usually means that the athlete has performed above his average skill level (aided by a measure of luck and ‘being in the zone’) for too long and is bound to revert to the mean.
What does the SI jinx have to do with stocks?
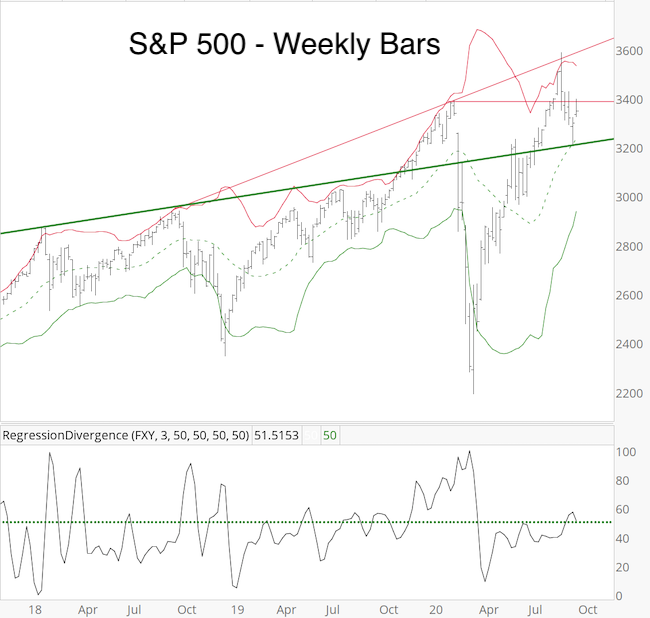
The above-mentioned trend line has been acting as a mean reversion average of sort. When price rallied above the trend line for the first time (November 2019 – February 2020) it reversed lower, so much lower that price snapped back and once again exceeded it (July 2020 – September 2020). Last week, price once again came back to the trend line.
If you enjoy quality, hand-crafted research, sign up for the FREE iSPYETF e-newsletter & market outlook
The chart below includes two more mean reversion gauges. The Bollinger Bands and RegressionDivergence. The center Bollinger Band converged with the support trend line at the time of the low (Sep 24) and the RegressionDivergence was smack dab neutral.

Based on the concept of mean reversion, the S&P 500 corrected enough to allow for the next rally.
Two Options
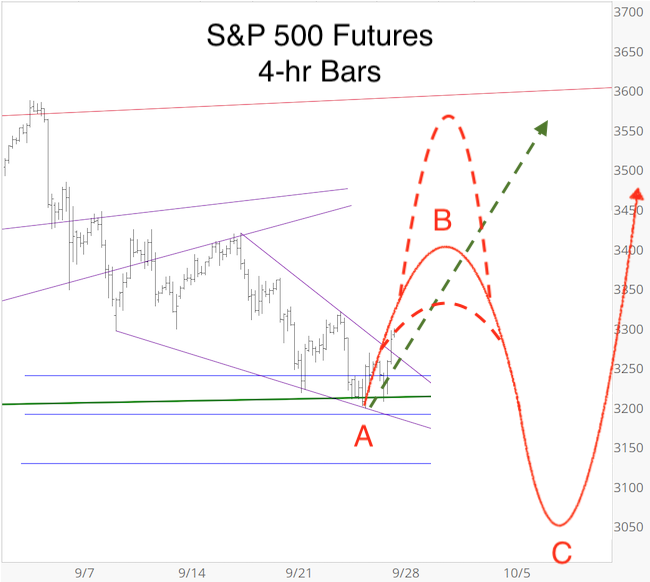
This is consistent with the S&P 500 projection and commentary published in the September 27 Profit Radar Report:

“Since price broke above purple diagonal/wedge resistance, we assume wave B is now underway. Waves B are the most difficult waves to predict, with no real price targets and patterns ranging from very choppy to grinding and relentless. Please note that the projections are not in scale in terms of time.
The alternative interpretation is that last week’s low was more important and will lead to new all-time highs (dashed green arrow). For the initial portion of this rally (or perhaps much of the rally, if it extends) it will be difficult to distinguish which option is playing out.”
Due to seasonality and pre-election uncertainty, stocks may still turn lower over the next 3 weeks, but more and more indicators are re-affirming a bullish fourth quarter tilt.
Continued updates are available via the Profit Radar Report.
Simon Maierhofer is the founder of iSPYETF and the publisher of the Profit Radar Report. Barron’s rated iSPYETF as a “trader with a good track record” (click here for Barron’s evaluation of the Profit Radar Report). The Profit Radar Report presents complex market analysis (S&P 500, Dow Jones, gold, silver, euro and bonds) in an easy format. Technical analysis, sentiment indicators, seasonal patterns and common sense are all wrapped up into two or more easy-to-read weekly updates. All Profit Radar Report recommendations resulted in a 59.51% net gain in 2013, 17.59% in 2014, 24.52% in 2015, 52.26% in 2016, and 23.39% in 2017.
Follow Simon on Twitter @iSPYETF or sign up for the FREE iSPYETF e-Newsletter to get actionable ETF trade ideas delivered for free.
