Subscribers to iSPYETF’s free e-mail newsletter receive a market outlook, usually once a week. The market outlook below was sent out on November 19. If you’d like to sign up for the free e-newsletter, you may do so here.
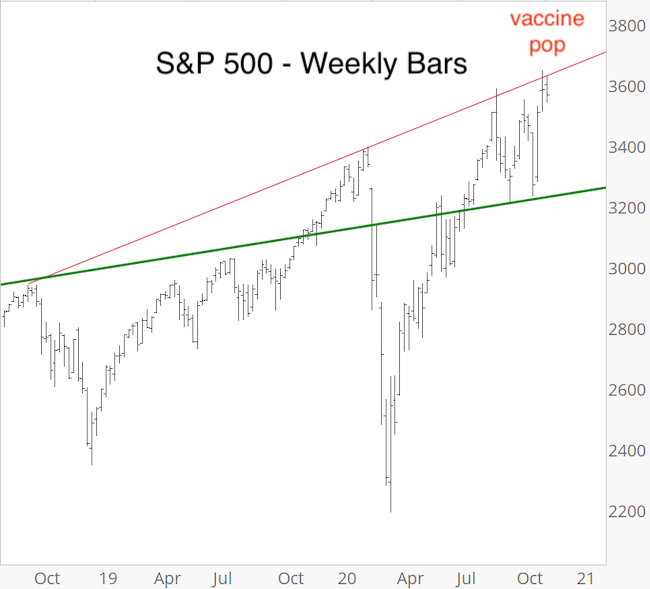
A ton has happened the last two weeks, but you wouldn’t know it by looking at the S&P 500 chart. The post-election/vaccine news pop (Nov 9) pushed price above the red resistance line for a couple hours, but that’s it.
Despite the continued S&P 500 (and Nasdaq) trading range, there’ve actually been a number of historically rare signals … elsewhere or under the hood.
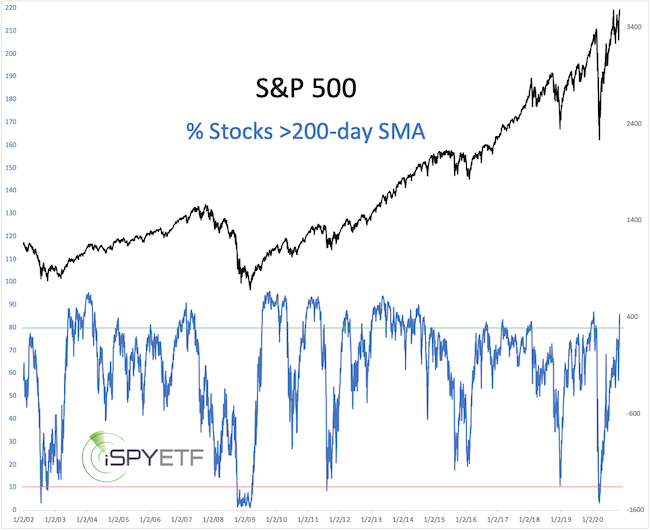
Signal 1: The percentage of S&P 500 stocks above their 200-day SMA has cycled from below 10% to above 80% (currently 88%, the highest reading since January 2020). Over the past 20 years, this has happened only 4 other times.
The chart below plots the S&P 500 against the percentage of S&P 500 stocks above their 200-day SMA. The 10% and 80% level are marked in red and green. The exact forward performance (graph and table) after the signal triggered was published in the November 15 Profit Radar Report.
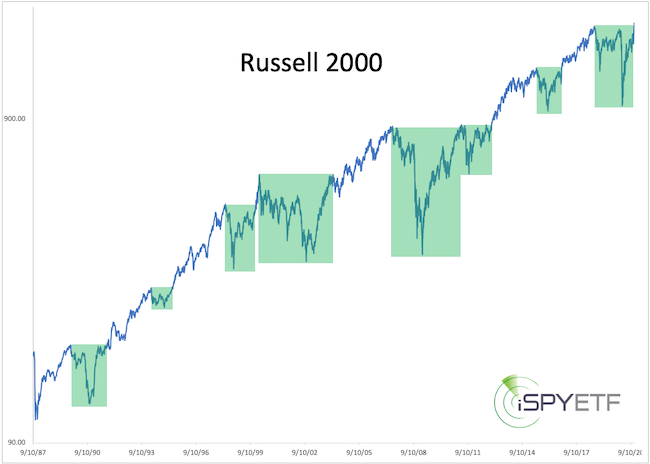
Signal 2: It took over 26 months, but the Russell 2000 finally exceeded its 2018 high. Over the past 35 years, the Russell 2000 set a new all-time high after a correction that lasted at least a year seven other times.
The green boxes highlight similar recoveries. The November 18 Profit Radar Report published the exact forward performance (graph and table) when the Russell 2000 did the same thing in the past.
Signal 3: On November 2, 3, 5, 9, 80% or more of NYSE volume went into advancing stocks. Over the past 50 years, up volume exceeded 80% on 4 of 6 trading days only 7 other times.
How did the S&P 500 do after similar ‘volume thrusts’? The November 15 Profit Radar Report showed the exact forward performance (graph and table) after the last 7 times this happened.
What’s the benefit of knowing the forward performance of past signals?
The Profit Radar Report shows the performance for the next 1, 2, 3, 6, 9 and 12 month along with odds of positive returns for each time frame. This allows investors to gage future risk and reward based on similar setups.
There is much noise, but when the market delivers 3 historically rare signals in a short period of time, it’s usually worth listening.
Continued updates along with the most likely long-term forward path for the S&P 500 (this was just published) are available via the Profit Radar Report.
The Profit Radar Report comes with a 30-day money back guarantee, but fair warning: 90% of users stay on beyond 30 days.
Barron’s rates iSPYETF a “trader with a good track record,” and Investor’s Business Daily writes “Simon says and the market is playing along.”