Subscribers to iSPYETF’s free e-mail newsletter receive a market outlook, usually once a week. The market outlook below was sent out on January 7. If you’d like to sign up for the free e-newsletter, you may do so here (we will never share your e-mail with anyone, just as we don’t accept advertising).
I enjoy helping people make educated investment decisions. To be educated one needs to have data (=knowledge) and interpret that data without being clouded by emotions or biases.
The Profit Radar Report filters a ton of data in an effort to discern the stock market’s next move. As this newsletter mentioned, there are times when future implications of the examined data are pointing in different directions.
This just happened in December. Almost every study based on stock market breadth projected rising prices and almost every study based on red-hot sentiment projected lower prices (I called this an epic tug-of-war).
Many of those studies were published in this December 1 article: Stock Market Risk is Clashing against Historical Strong Reward Potential.
My data-based conclusion at the time was as follows: “Normally the combination of historic investor optimism while stocks are pressing against long-term resistance is a recipe for disaster. But, as the above studies show, strong stock market internals are likely to over-power other risk factors.”
Since December 1, 2020, the S&P 500 has slowly risen from 3,660 to 3,800 … but internal breadth actually deteriorated.
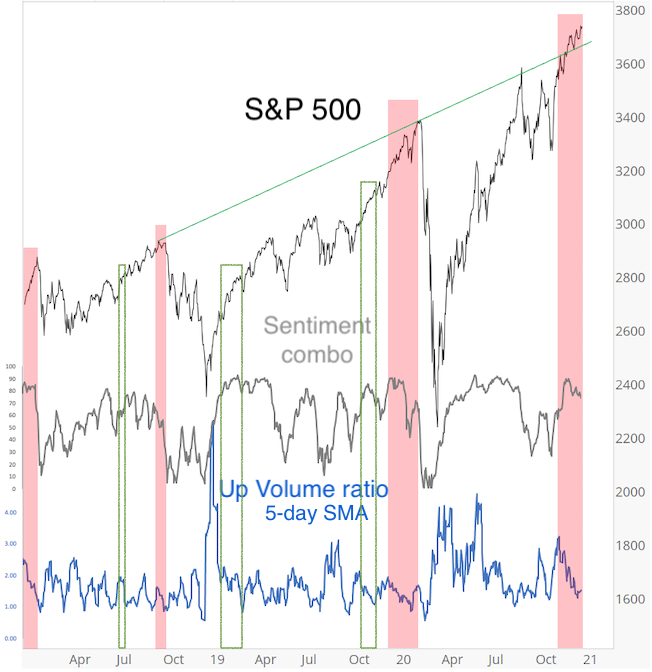
The chart below (published in the December 30 Profit Radar Report) plots the S&P 500 against the NYSE up volume ratio (5-day SMA, which shows how much volume goes into advancing vs declining stocks).
Throughout December, the S&P moved higher while the up volume ratio declined. About 50% of the time that led to an immediate nasty pullback (red bars) but other times price continued higher (green boxes).
Interestingly, investors lost some of their bullishness the last 2 weeks of December (see gray graph, which is a composite of sentiment gauges). In other words, the tug-of-war tension eased a bit and allowed for further gains.
Even though overall bullish, the Risk/Reward Heat Map just saw an up tick in risk for January and February.
For this risk potential to turn into reality, however, the S&P 500 needs to drop below the green trend line. Price can continue to grind higher as long as it stays above.
Even though 2020 has brought unprecedented stock market action, there are actually a number of years that have shown a very similar general trajectory (see chart below).
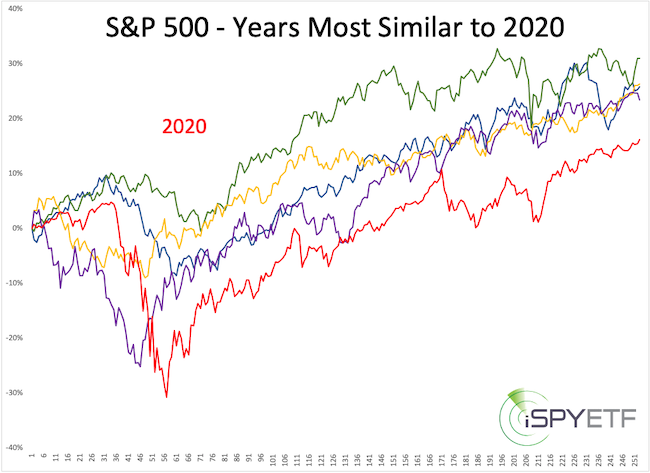
The soon to be published 2021 S&P 500 Forecast will show how the S&P performed after years with a similar trajectory.
Continued updates and the new 2021 S&P 500 Forecast are available via the Profit Radar Report.
The Profit Radar Report comes with a 30-day money back guarantee, but fair warning: 90% of users stay on beyond 30 days.
Barron’s rates iSPYETF a “trader with a good track record,” and Investor’s Business Daily writes “Simon says and the market is playing along.”