It’s not often that a stock pulls back after beating on earnings and outlook.
Yet, Spotify (SPOT) did just that.
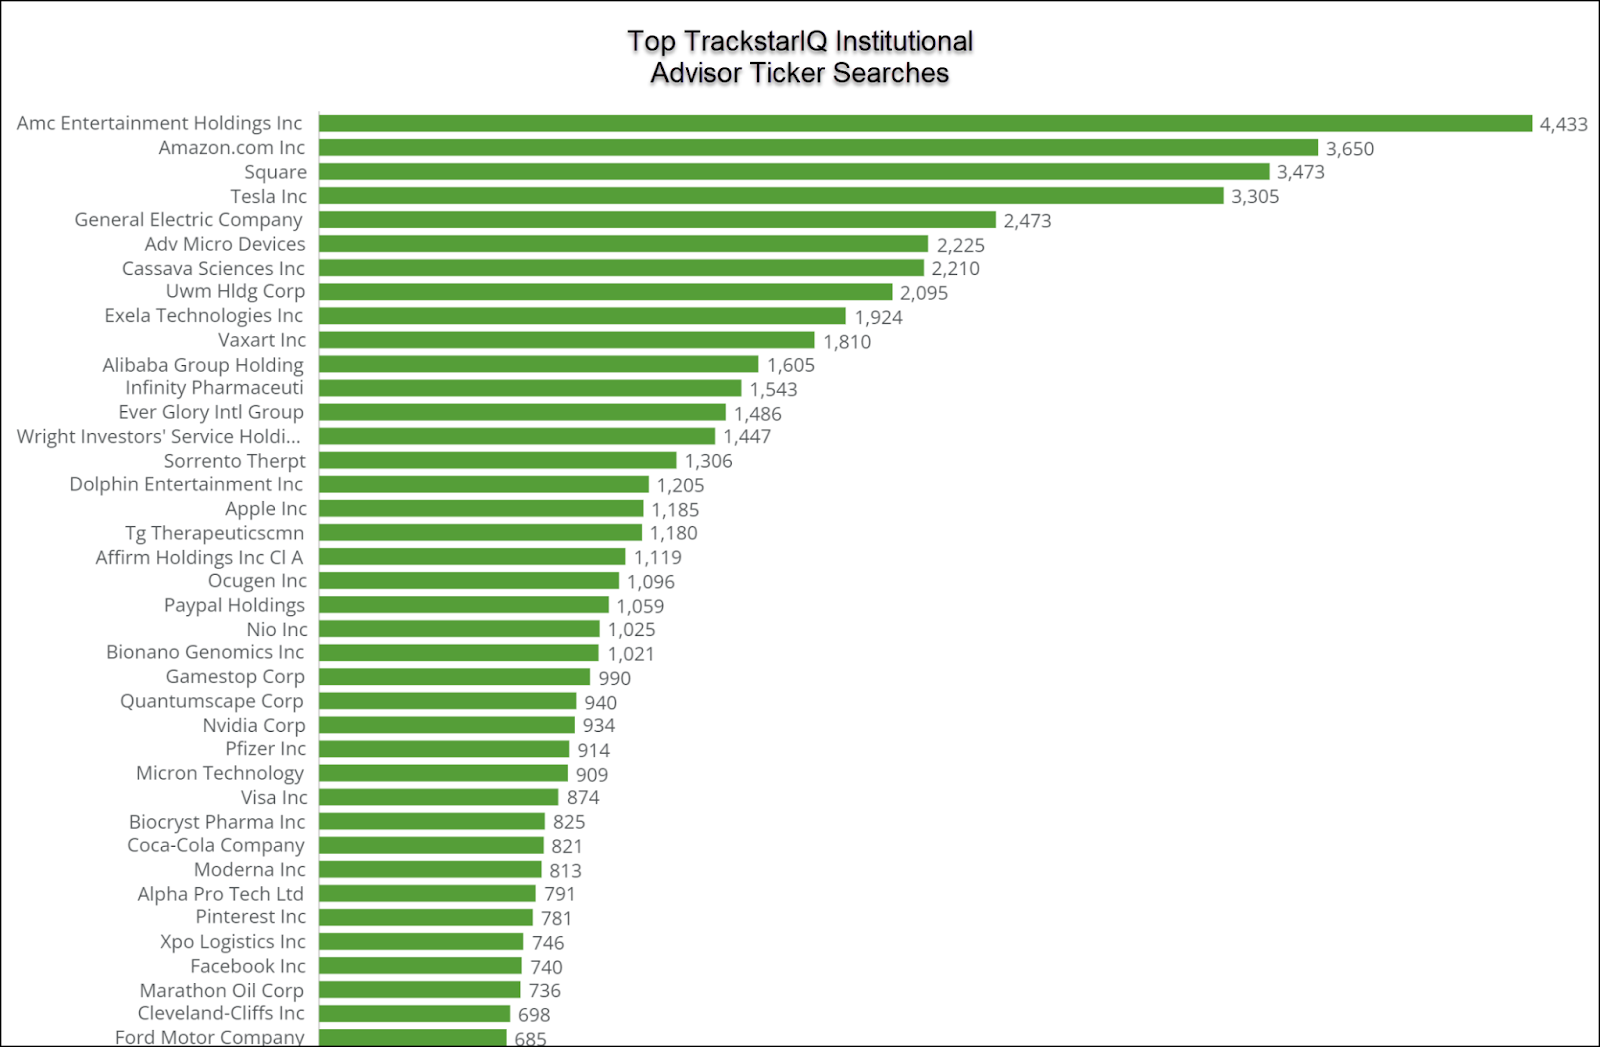
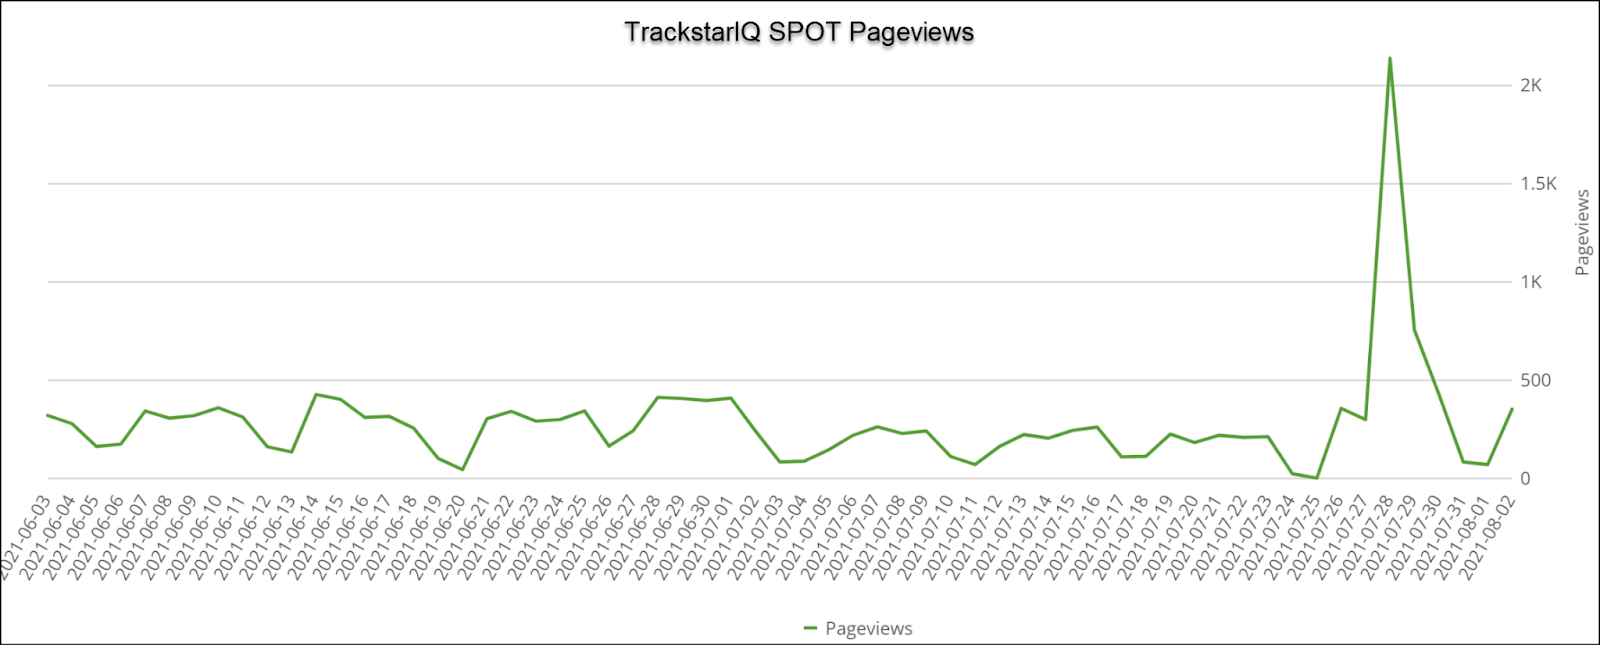
That might help explain why our TrackstarIQ data picked up marginal interest after the typical earnings search surge.
Shares are off more than 40% from their February highs.
Bears worry that Spotify doesn’t have a competitive advantage.
Bulls say the low churn rate and continued engagement leave plenty of upside potential.
So who’s right?
Let’s find out.
Spotify’s basics
Spotify was founded back in 2006 in Sweden. Yet, it wasn’t until 2018 that the company was listed through their IPO in the U.S.
The streaming giant generates revenues through advertising and premium subscriptions.
Surprisingly, premium services are their largest revenue segment.
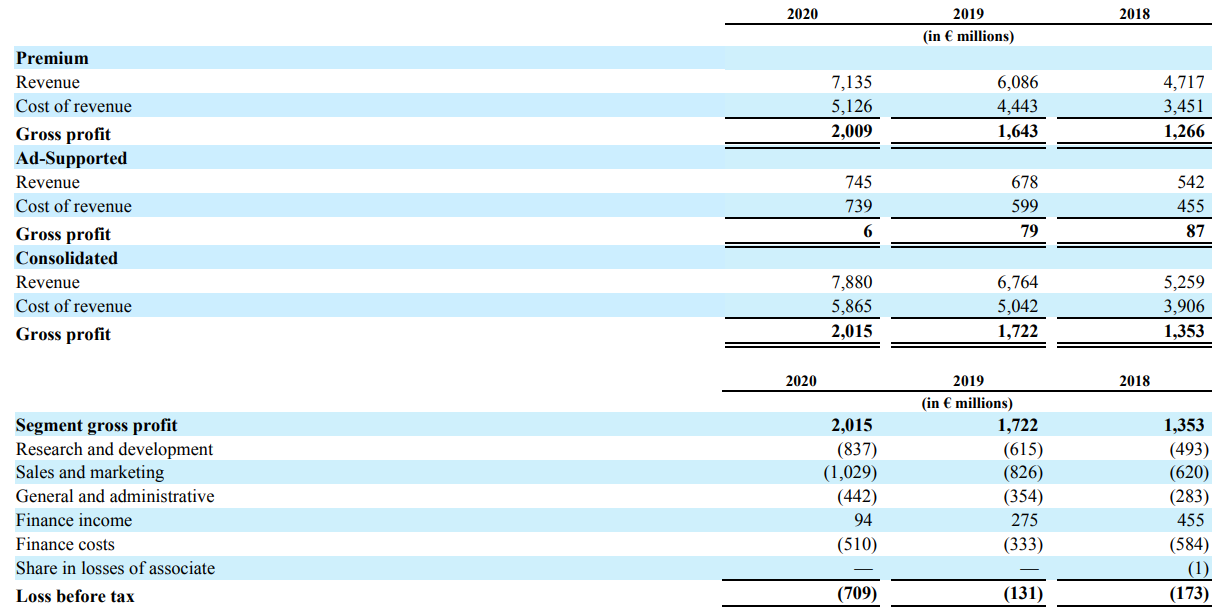
What’s not immediately apparent is how crucial the advertising side is to the premium.
60% of the premium subscribers come from the ad-supported services sales funnel, allowing Spotify to scale up quickly.
That’s why despite the poor margins, Spotify keeps investing in their ad-supported business.
Additionally, the company is making heavy investments in exclusive content, especially in the podcast arena.
The problem is the low-margin ad business grew at 46% YOY while premium only rose 14%.
That primes the sales funnel but hurts their current profitability.
Profitability concerns
You’ll notice from the table above that Spotify doesn’t turn a profit.
However, they generate cash from operations at a clip of $300M-$500M…or so it might seem.
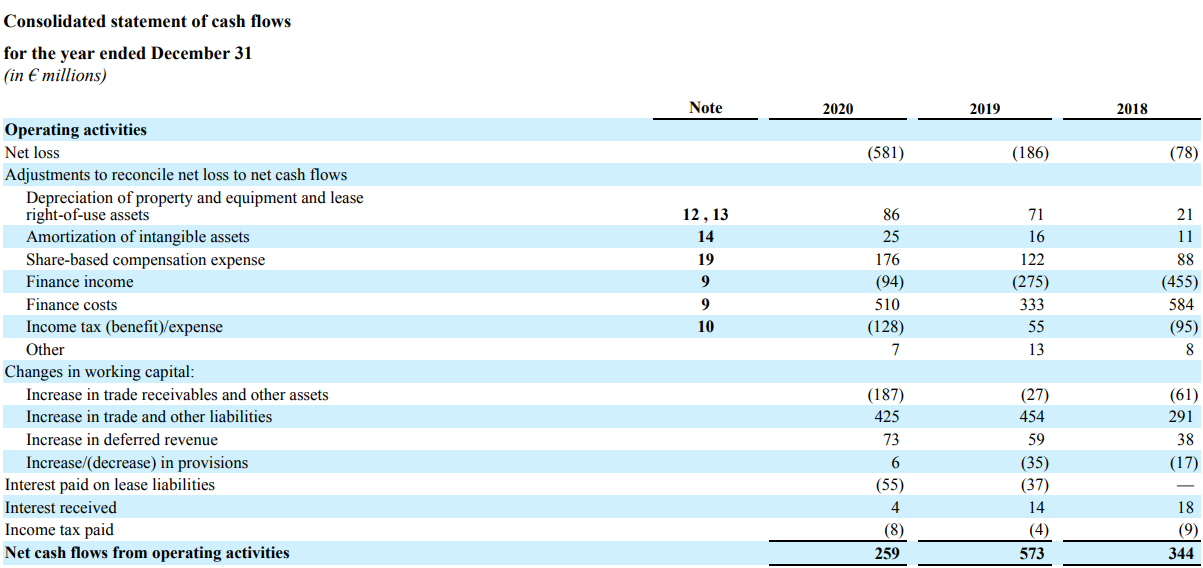
Notice that their largest line item is finance costs.
When you look up the breakdown, you find the following table:
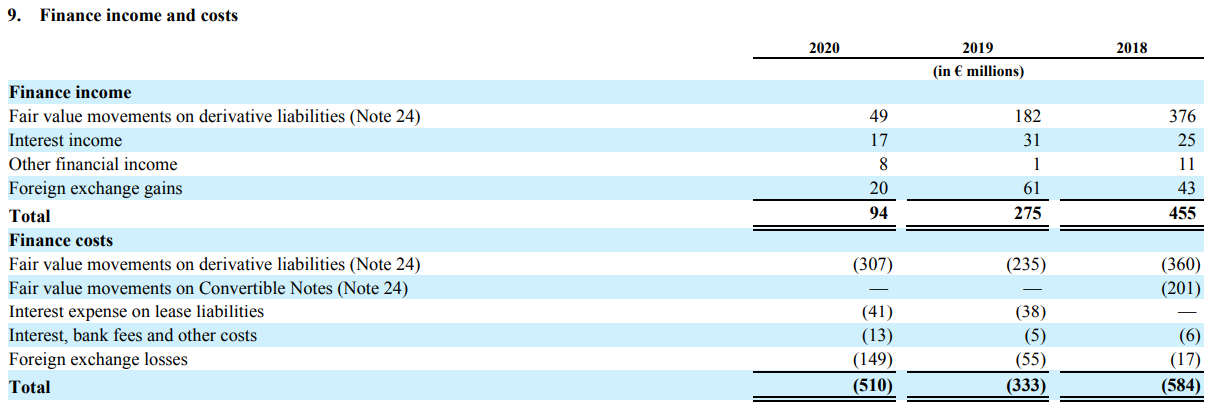
Part of those movements are foreign exchange hedges since the company transacts all over the globe.
The rest are related to warrants and other derivatives.
Yet, there’s something else most folks forget about.
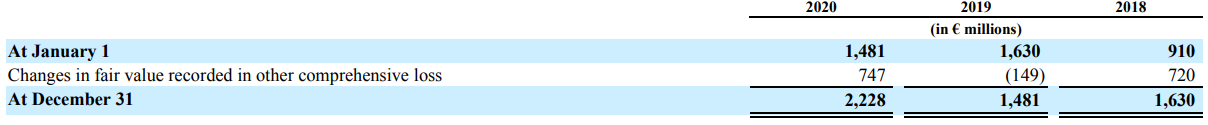
Spotify owns 9% of Chinese giant Tencent while Tencent owns 7.5% in Spotify.
You see, back in 2017, Tencent tried and failed to buy Spotify. Instead, they did an equity swap.
Effectively, they own $2.6 billion worth of Tencent stock.
Sometimes that helps and sometimes it hurts their bottom line.
The important point is that their cash flow statements provide a reasonably accurate representation of their profitability.
One way to look at them is their operating cash flow per share which comes in at $2.15.
If somehow $2.15 was their EPS, you’d still be left with a 100x P/E valuation.
That’s a tough pill to swallow when their 5-year average revenue growth is 32%.
And if you look at Free cash flow per share, the most recent measure puts them at $1.57. Again, still pricey.
Our hot take
It’s tough to love the stock at these valuations, even when you take growth into account.
You could make an argument that a discounted cash flow stream analysis might support higher share prices.
But you’d have to make some generous assumptions about free cash flow growth that hasn’t materialized yet.
Top-trending tickers, market-moving news alerts: Straight in your inbox!
See the pulse of the market as researched by Wall Street Elites and receive top-trending tickers and other market intelligence to inform your trades.Sign up for Wall Street Connected – our free daily newsletter that leverages our TrackstarIQ Data.
Click here to learn more