What is the perfect size for a company that makes it an ideal investment?
How we answer that question depends on the business cycle.
Economic expansions favor small and mid cap companies.
Contractions favor large businesses with warchest balance sheets.
So what do we make of the current environment?
We’re certainly on the upswing from last year’s lockdowns.
But to call this an expansion overstates the potential.
It’s like that line from The Rembrandts theme song to Friend’s where “we’re always stuck in second gear.”
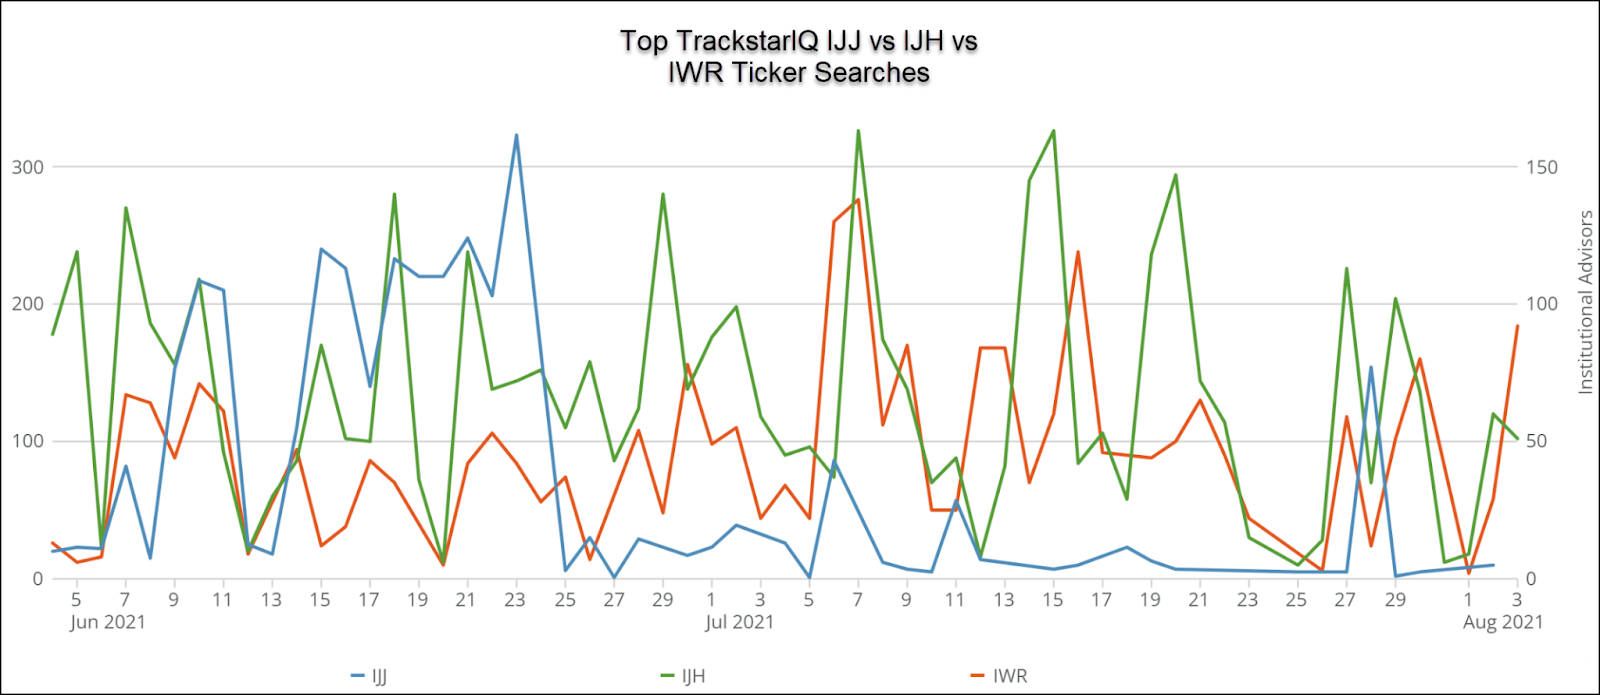
According to our TrackstarIQ data, institutional advisors have shown more interest in mid-caps than other sectors lately.
And that makes a lot of sense.
Small caps haven’t performed nearly as well as large caps.
Heck, they’ve been playing second fiddle for over a decade.
Large cap names look overbought and show an underwhelming value at the moment.
Mid-cap hits that Goldilocks area.
What you may not realize is that not all mid-cap ETFs have performed the same.
That’s why we pulled together three ones that we think are worth a second look.
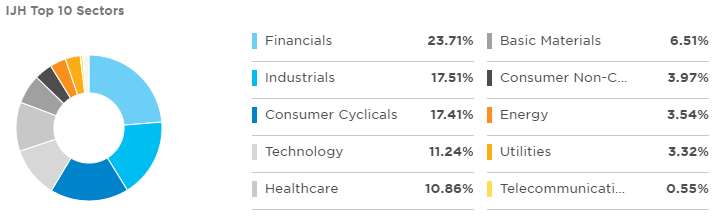
iShares Core S&P Mid-Cap ETF IJH
iShares IJH ETF is the largest of the mid-cap ETFs in terms of assets with $63.3 billion under management.
The ETF is true to its name with about as pure a mid-cap benchmark as you can get.
It’s highly liquid with 1.2 million shares traded daily making it ideal for portfolios of all sizes.
With a dirt cheap expense ratio of $0.05%, and 400 it provides inexpensive exposure to a broad basket of companies.
Plus the 1.08% dividend doesn’t hurt.
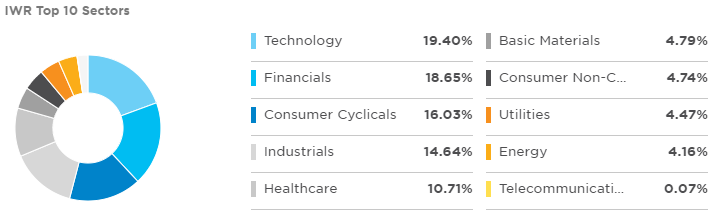
iShares Russell Mid-Cap ETF IWR
The IWR is only up 16.95% compared to the IJH 17.53% on the year.
But it’s one of the only mid-cap ETFs that is currently making new all-time highs.
The IJH hasn’t done so since May.
The differences here are slight but important. Mainly, the IWR incorporates more large-caps into its 815 holdings. For example, it holds companies like Twitter, Roku, and DocuSign.
It also is skewed more towards technology than finance.
The IWR comes with a higher expense ratio at 0.19% and a smaller yield at 0.99%.
However, it does trade more shares per day than the IJH as it only costs ~$80 per share vs ~$270 for the IJH.
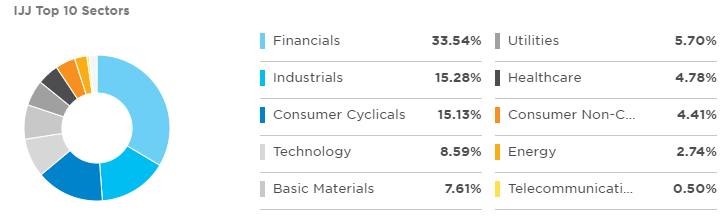
iShares S&P Mid-Cap 400 Value ETF IJJ
The IJJ takes mid-cap companies and adds a value twist.
Holdings are selected based on price to book, price to earnings, and price to sales ratios with an annual rebalance each December.
Unsurprisingly, this index leans very heavily into financials which make up over a third of the holdings. Technology falls down to only 8.5% of the ETF’s portfolio.
With 312 holdings, a 0.18% expense ratio, and a nice 1.4% dividend yield, the IJJ provides a nice balance of payout and depth.
Our hot take
The sector exposure is an important part of ETF selection.
For example, if and when the Fed raises interest rates, the IJJ should benefit more given its heavy exposure to financials while the IWR could see a serious pullback.
Make sure you look at how these sectors play into your overall portfolio balance.
Questions from your clients
- What type of growth can we expect in the second half?
- Should I be worried about a correction?
- How often should I rebalance my portfolio?
- What can I do as an investor to improve my performance?