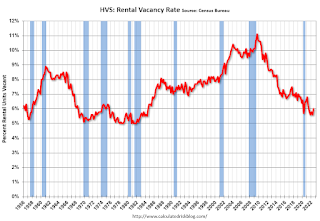
The results of this survey were significantly distorted by the pandemic in 2020.
This report is frequently mentioned by analysts and the media to track household formation, the homeownership rate, and the homeowner and rental vacancy rates. However, there are serious questions about the accuracy of this survey.
This survey might show the trend, but I wouldn’t rely on the absolute numbers. Analysts probably shouldn’t use the HVS to estimate the excess vacant supply or household formation, or rely on the homeownership rate, except as a guide to the trend.
National vacancy rates in the third quarter 2022 were 6.0 percent for rental housing and 0.9 percent for homeowner housing. The rental vacancy rate was not statistically different from the rate in the third quarter 2021 (5.8 percent) and 0.4 percentage points higher than the rate in the second quarter 2022 (5.6 percent).
The homeowner vacancy rate of 0.9 percent was virtually the same as the rate in the third quarter 2021 (0.9 percent) and not statistically different from the rate in the second quarter 2022 (0.8 percent).
The homeownership rate of 66.0 percent was 0.6 percentage points higher than the rate in the third quarter 2021 (65.4 percent) and not statistically different from the rate in the second quarter 2022 (65.8 percent).
emphasis added

The results in Q2 and Q3 2020 were distorted by the pandemic and should be ignored.

Once again – this probably shows the general trend, but I wouldn’t rely on the absolute numbers.

The HVS also has a series on asking rents. This surged following the early stages of the pandemic – like other measures – and is up 10.9% year-over-year in Q3 2022.
The quarterly HVS is the timeliest survey on households, but there are many questions about the accuracy of this survey.