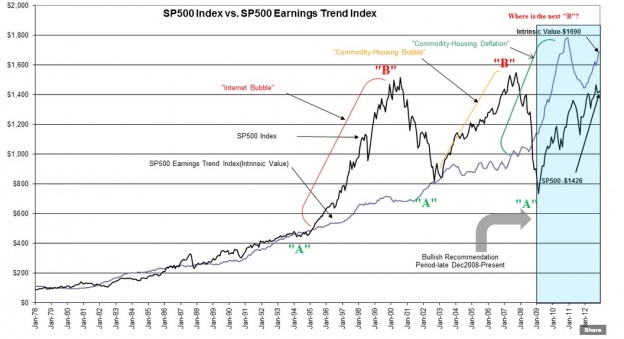
The S&P 500 ($SPY) Intrinsic Value* is a calculation performed solely by myself and is based on Knut Wicksell’s 1898 definition of how he perceived investment rates of return arbitraging over a business cycle to the “Natural Rate” or the average rate of growth of all investments in one’s economy. For the US economy this is the Real GDP + Inflation and I call this the “Prevailing Rate”. The term Prevailing Rate is the long term average return of Real GDP + the best measure of 12mo Inflation which comes from the Dallas Fed as 12mo Trimmed Mean PCE. Today this rate is 4.62% with the inflation measure at 1.6%.
*SP500 Intrinsic Value is solely my own construction and not endorsed by Oppenheimer&Co.
Over time (since 1978) investors have priced the median average of SP500 earnings at a level consistent with the Indigo Line in the chart below titled SP500 Earnings Trend Index(Intrinsic Value). The relationship remained fairly close with periods of over/under valuation till 1995 when Hedge Funds gained prominence as investment vehicles and we suddenly found that wide variation was beginning to occur. Mainly this variation was towards excess pricing with the Internet Bubble of 2000 and a Commodity/Housing Bubble in 2007. But, with the elimination of the controls on short selling in 2007, we also have witnessed the SP500 plunge well below the historical support of Intrinsic Value.
My interpretation is that it is true value investors, i.e. Warren Buffett, Seth Klarman, Chris Davis, Marty Whitman and select other known value investors who think long term historically provide general market support near the Intrinsic Value through their increased buying of equities. They increase their buying of equities primarily because stocks are priced substantially lower than the expected future earnings streams. (They tell us that they think this way during these periods through multiple media interviews.) When the SP500 is much higher than the Intrinsic Value, they also tell us they view most stocks as overpriced.
What is learned by reviewing the media reports across a business cycle, is that one can come to the conclusion that there are basically 2 types of investors. There are those who know how to value stocks independently along the lines first proposed by Knut Wicksell in 1898, the value investors, and then, there is everyone else who either imperfectly follow prominent value investors or those who apply various forms of trend following and computer generated algorithms(Hedge Funds). Coupled to the trend followers is the widely held belief markets operate as if controlled by an “Invisible Hand” and somehow are able to correctly price securities when few of the many investors who comprise the markets have the skills to do this. Unfortunately, most investors believe in the myth of “The Invisible Hand”. Trend followers justify prices by pointing to changes in economic, political or tax news. They are “News Buyers/Sellers” as they believe that the markets correctly price news events efficiently and fairly. Some call this “Efficient Market Theory” first promoted by Eugene Fama. I think it is fairly easy to see that “The Invisible Hand” and “Efficient Market Theory” are quite similar and equally incorrect.
In our current investment environment, many remain pessimistic and the SP500 is priced below its Intrinsic Value by ~14%. If we progress economically as we have historically from this point, I fully expect that today’s pessimism will ease and the bulk of investors will very likely leave the very low returns in 10yr Treasury Bonds of 1.8% and those of shorter maturities and lesser returns to invest in the higher returns present in equities. The simple math indicates that current returns in SP500 due to the mean earnings today of $78.10shr actually represent 5.23% Earnings Yield which should be compared to a 5yr Treasury Yield of 0.76%. At some point investors become more optimistic and actually panic at missing a return of over 5% vs. 0.76% and funds shift from bonds to stocks.
While I cannot tell you when this shift will occur, many believe that this shift is occurring today. Historically we do have a record of markets going from undervalued levels to excessively overvalued levels when shifts like this occur. We had this in 2000 with investors overpricing the SP500 by 100% and again in 2007 as investors overpriced the SP500 by ~55%. Should 50% overpricing occur at the next market peak it is possible that we could have the SP500 higher than $2,500. This would be typical market psychology running amok, but anticipating such an occurrence does not come with precision. The best I can do is to monitor current market pricing and act accordingly.
By the SP500 Intrinsic Value (which only I calculate) the market looks undervalued represents a decent opportunity for investors. I believe it represents a means of assessing fair market value and any differences from the SP500 represent aberrations due to market psychology. If past patterns hold, then we are likely to see much higher levels for the SP500 in the next several years.
The post Intrinsic Value of S&P 500 Using Inflation And GDP Growth appeared first on ValueWalk.
