By Surly Trader
If you spend enough time looking at charts, you can start seeing correlations anywhere. The human mind generally wants to create patterns so that we can simplify what we are looking at. Today I just want to look at two time series – average automobile gasoline prices and corporate high yield spreads. The high yield spreads can actually be replaced with most “risk” assets such as equities, but I think the picture is cleaner when looking at high yield.
There are many reasons that gasoline prices might be a good predictor of market conditions. Spikes could be due to: 1) robust economic growth and subsequent demand 2) easy monetary policy and printing of money which devalues the currency (thereby increasing nominal asset prices) 3) foreign affairs risk flare ups as we often see in the middle east or 3) high sensitivity to/from the US consumer
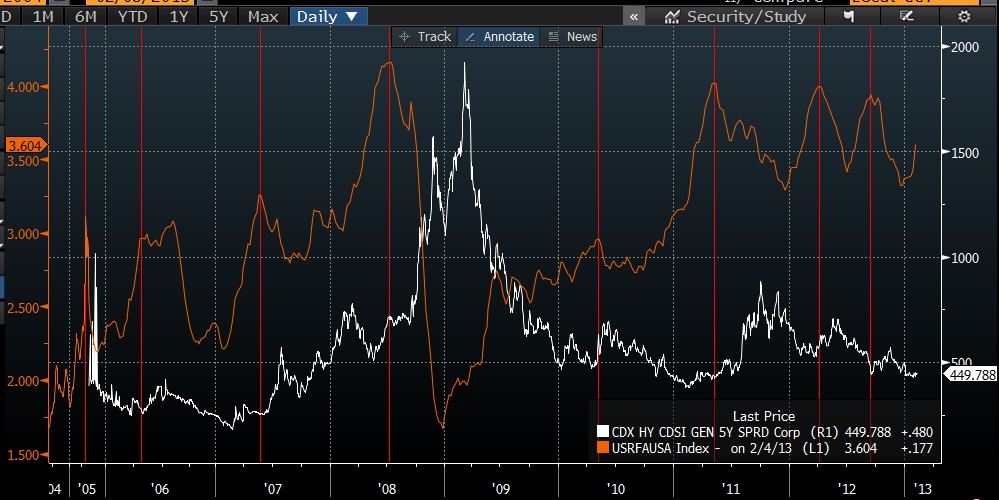
If we take a look at the two series, there is definitely a strong relationship:
White Line – High Yield Spreads, Orange Line: Average gas PricesRemember that when the white line goes up it is bad, when it goes down it is good (credit spreads/credit risk)
For about the last 10 years, when gasoline hit a peak price and then declined, we saw a subsequent sell off in the corporate high yield market. There was not an immediate response from the market, but it certainly happened every time. Likewise, when gasoline prices were rising it was usually a pretty risk-on environment.
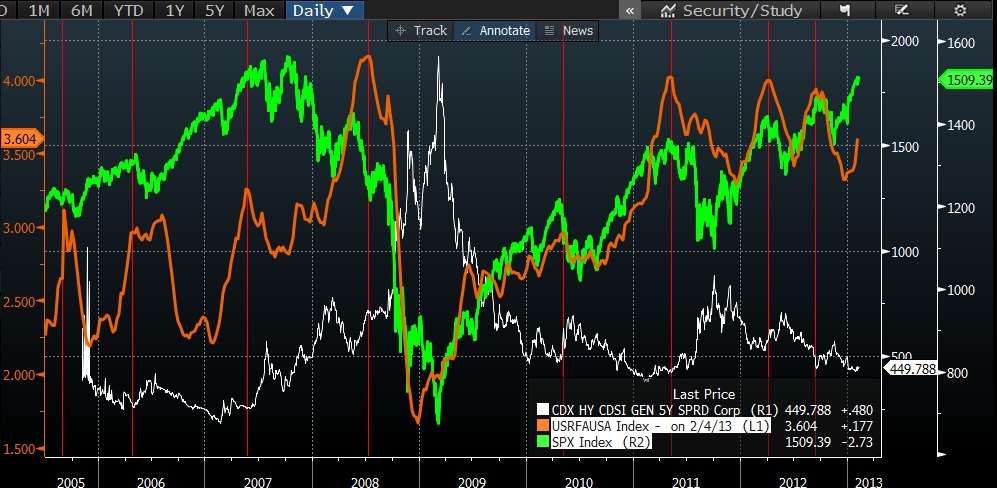
You can see this correlation with the S&P 500 as well:
Gas prices are not a perfect indicator, but definitely a market factor to keep your eyes on.
The post Do Gas Prices Provide a Good Market Indicator? appeared first on PRAGMATIC CAPITALISM.

