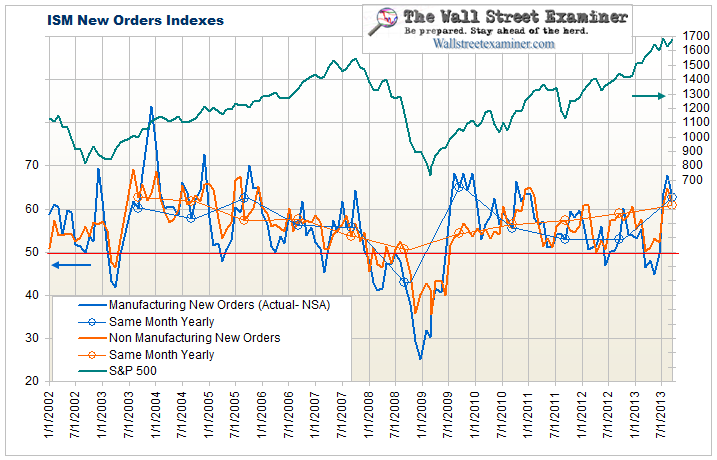
The March headline seasonally adjusted aggregate Manufacturing Purchasing Managers Index reading of 51.3 was substantially worse than the consensus expectation of 54, reversing the trend of the professional econoquacks underestimating the economy. Last week they overestimated the improvement in weekly unemployment claims, so they’ve now gone from being too pessimistic most of the time to apparently being too optimistic.
The not seasonally adjusted ISM Manufacturing New Orders index plunged from 55.3 in February to 46.4 in March. This was the lowest March reading since 2009, and the drop of 8.9 points was worse than any March decline in the prior 10 years. This is not a fluke. Durable Goods orders in February were also down year to year. Now it looks as though March will continue and maybe even accelerate the weakness.

The ISM reports only the seasonally adjusted (SA) data. To derive the actual data we need to divide the reported data by the SA factors, which are established by the US Department of Commerce each year in advance. Later, all of the SA data is rebenchmarked and restated. In January the ISM just issued a restatement of all the Manufacturing and Non Manufacturing indexes since 2009, making the previously reported headline numbers for each month essentially garbage. That’s another reason why it’s so important to look at the actual unmanipulated data.
In order to get an idea of how good or bad the actual NSA number is for March we must compare it to March in past years. March was a down month in 6 of the past 10 years, so it is not unusual that this March was down. What is unusual is the size of the decline. This year’s fall of -8.9 was the worst in at least 11 years. The March average month to month change over the previous 10 years was -1.6 Last year the reading was +0.4 and in 2011 it was -1.4. So by any standard, this March was a terrible month for US manufacturers.
The decline in US manufacturing in the face of massive Fed money pumping is troubling to say the least. By the same token, with manufacturing just 11% of US GDP, it may not mean that much to the economy, and it obviously means even less to the stock market.
The current negative reading is near the level reached in March 2007, which was 7 months before that bull market ended. It’s impossible to say how long a lead time new manufacturing orders may have, if any, before the next bear market. There’s no cause and effect relationship here.
New orders trended lower from late 2003 to 2007, while stock prices continued to rise. That was a potential hint that the stock market may have been in a bubble beginning in 2005, since it kept rising while new factory orders were slowing. At the time, the Fed was growing its balance sheet steadily at the rate of 5% per year. With the Fed increasing the size of its balance sheet by 38% this year, the stock market making new highs, and manufacturing activity weak, we can again conclude that the Fed is creating yet another bubble.
The difference between 2007 and today was that the Fed stopped growing its balance sheet in May of that year. Now it is doing exactly the opposite by injecting cash into the markets at a record pace with no end in sight. Under the circumstances, a dying US manufacturing sector will make little difference to the markets until the Fed is forced to stop the money printing.
by Lee Adler
Stay up to date with the machinations of the Fed, Treasury, Primary Dealers and foreign central banks in the US market, along with regular updates of the US housing market, in the Fed Report in the Professional Edition, Money Liquidity, and Real Estate Package. Try it risk free for 30 days. Don’t miss another day. Get the research and analysis you need to understand these critical forces. Be prepared. Stay ahead of the herd. Click this link and begin your risk free trial NOW!