Chart of the Day: Real Gold Prices - InvestingChannel

Chart of the Day: Real Gold Prices

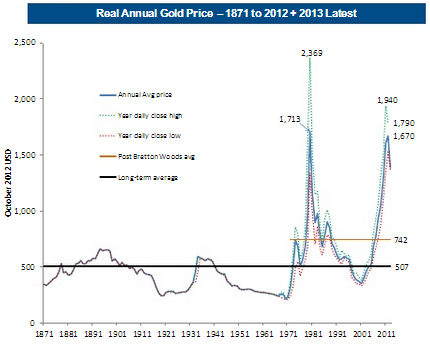
Here’s some perspective on the recent gold rally and decline.  Via Goldman Sachs:

  • The 2012 average gold price was only 2.5% lower than the 1980 average of $1,711/ounce in real terms.
  • The long-term real price average is $507/ounce, and the post Bretton Woods (1972 onwards) average is$741/ounce.
  • Despite the latest price drop, prices remain high historically.

real gold Chart of the Day: Real Gold Prices

The post Chart of the Day: Real Gold Prices appeared first on PRAGMATIC CAPITALISM.
Related posts

Carl Icahn Increases His Stake In Take-Two Interactive To 10.68%

ValueWalk

iPad Mini Display Outperformed By Kindle Fire HD & Nexus 7

ValueWalk

Foxconn Might Open Manufacturing Plants In The U.S. [REPORT]

ValueWalk

Peter Cundill Protégé Tim McElvaine on Investing in Japan [VIDEO]

ValueWalk

Set Bing Home Page Image As Lock Screen In Windows 8

ValueWalk

Morning Market News: JCP, APO, MCHP, ZIP, ENR, LGF, EA, ATVI, COV, LNT

ValueWalk