By Walter Kurtz, Sober Look
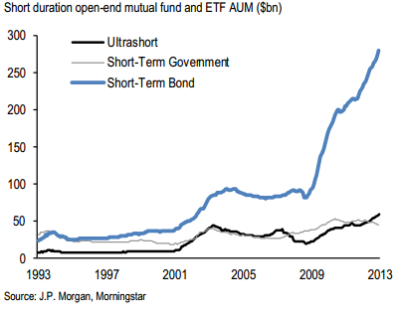
As discussed earlier (see post) the ongoing reallocation out of money market funds combined with the Fed’s monetary expansion has resulted in fund flows into short-term bond funds as a cash substitute. The AUM of short-term (non-government) bond funds hit another record recently with no signs of slowing down (see figure 1).
As these funds deploy all this new capital however, they are finding it more difficult to purchase quality bonds that meet their criteria. The longer duration income funds actually started putting some money into equities, which they are usually allowed to do under the prospectus.
WSJ: – Some funds, however, are piling into equities. The $15.4-billion Loomis Sayles Strategic Income fund has ratcheted up its stock and preferred-stock allocation to more than 19%, from 5% in mid-2011. Co-portfolio manager Matt Eagan said that the fund’s managers decided most bonds were so overpriced that it was worth taking on some stock risk to avoid pain in bonds.
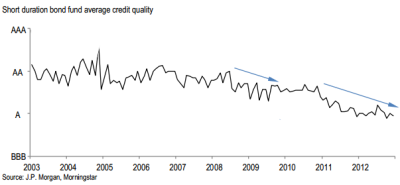
Shorter duration bond funds typically don’t invest in equities, yet they are facing the same problems – it’s difficult to generate even mediocre returns in higher rated bond markets. And often there aren’t even enough bonds for sale (dealers don’t hold much inventory and institutions don’t want to part with their bonds). The solution is simple – these funds are migrating down the quality spectrum (see figure 2).
(Figure 1 – Source: JPMorgan)
(Figure 2 Short-term bond funds – Source: JPMorgan)
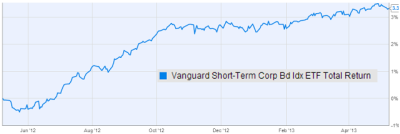
In spite of the increased risk, performance in this space is worsening with time. As an example, the Vanguard Short-Term Corporate Bond ETF (VCSH) returned 3.3% during the past year (May-2012 to May-2013), but just over 2% annualized in 2013. Going forward that return will be even lower, forcing savers to move into riskier assets or to accept an ever lower return for higher amounts of risk. One day, however these investors will wake up to find out that short-term bond funds are actually not true cash equivalents.
Total return, including interest income (Source: Ycharts)


