Reader Tim Wallace took note of Bernanke’s testimony on jobs (see Bernanke’s Semi-Annual Tap-Dance of Distortions, Half-truths, Lies, and Hypocrisy to U.S. Congress) and sent me the following chart.
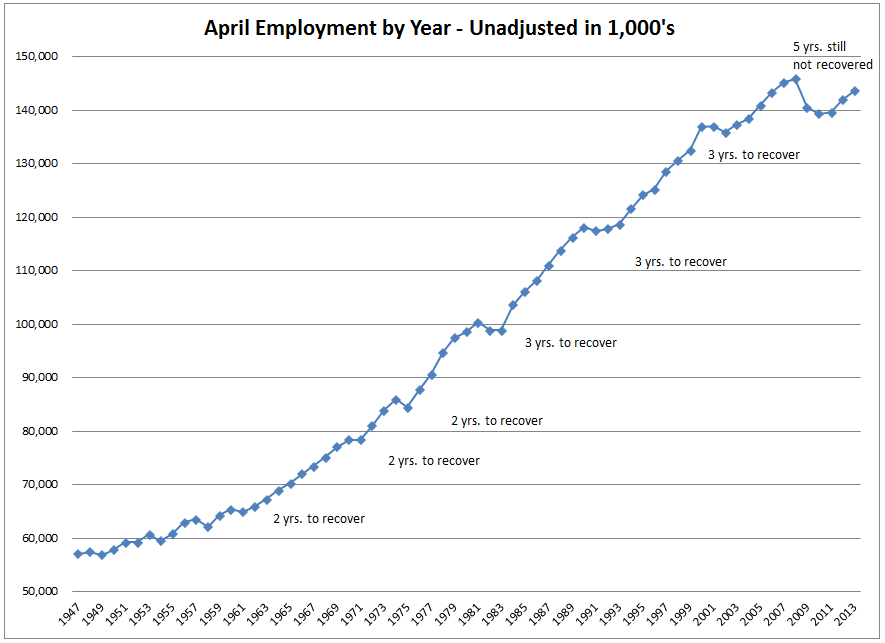
April Employment vs. April Employment in Previous Years
click on chart for sharper image
Tim writes …
Hello Mish
Bernanke was touting the direction of employment using the familiar “7.5%” numbers and pointing to all the improvement. While granting that more people are working now than in 2010, we recognize that more people are working part time and less people are working overall than in 2008.
This got me wondering how long it took to recover to pre-recession employment numbers in the past.
Up until the recession of 1982, All drops in employment from one year to the next had fully recovered to new employment highs within 2-3 calendar years. In the recessions around 1982, 1991 and 2001, job recovery took about three calendar years.
In our current malaise, we have been at this 5 years and employment is still 2.2 million people below the employment number in April 2008. Moreover, part-time employment is up about 2 million workers. Thus, full-time employment is 4 million below the 2008 number, 5 years ago.
Tim
Mike “Mish” Shedlock
http://globaleconomicanalysis.blogspot.com