There are times when short-term charts offer little to no guidance, and there are times when a chart just oozes with valuable clues about the market’s whereabouts. The later is true right now. Head-and shoulders, Fibonacci, trend lines, etc., this chart has it all.
Sometimes a picture is truly worth more than a thousand words.
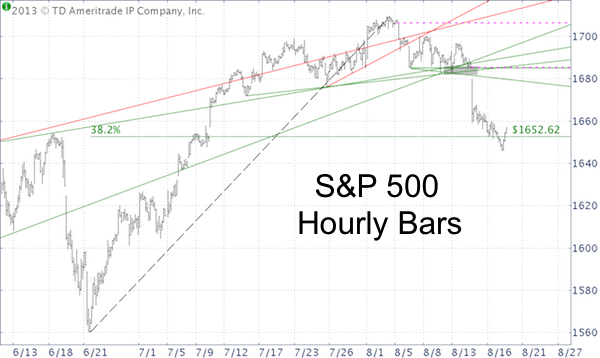
The hourly S&P 500 (SNP: ^GSPC) chart below is jam-packed with interesting clues.
1) There is a head-and shoulders topping pattern with a neckline at 1,681. Several trend lines converging at the same area reinforce the importance of the neckline.
The setup was so plain that the August 14 Profit Radar Report recommended to go short with a move below 1,681.
2) The target of a head-and shoulders breakdown is determined as follows: Calculate the difference between the head (1,709) and the neckline (1,681) and project it to the down side (1,652). The head-and shoulders target is 1,652, which the August 15 Profit Radar Report outlined as initial down side target.
3) As the chart shows, 1652 is also the 38.2% Fibonacci retracement of the points gained from June 24 to August 2. 1,652 is thus an important support/resistance level.
4) There are two open chart gaps (dashed pink lines).
What happens if the S&P 500 (NYSEArca: SPY) falls and stays below 1,652? It will probably continue south until the next support level.
It’s interesting to note that the VIX (Chicago Options: ^VIX) created a similar head-and shoulders formation with an up side target around 15. This up side target was reached as well.
The Nasdaq-100 (Nasdaq: QQQ) – buoyed by Apple – could care less about head-and shoulders patterns as it may be worried about its open chart gaps.
Conclusion
The S&P 500 (NYSEArca: IVV) is clinging to the 1,652 level. If it fails to hang on, it will drop to the next support level. On the flip side, there are open chart gaps at much higher prices.
Sunday’s special Profit Radar Report takes a detailed look at seasonality (both the S&P 500 and VIX), sentiment (8 different sentiment/money flow gauges), technical analysis, and Elliott Wave Theory and visually projects the two most likely paths stocks will take over the coming weeks.
Simon Maierhofer is the publisher of the Profit Radar Report.
Follow him on Twitter @ iSPYETF.