Since their inception, the SPDR S&P 500 ETF has almost always confirmed new highs of its cousin, the Select Sector Financial ETF. The only time it didn’t was in 2007 … and today. Here’s what makes this potential repeat intriguing.
For all the Whac-a-Mole bears who’ve been getting clobbered by the omnipresent bull market mallet, there’s finally a faint ray of hope flickering out of the same black hole that caused the last financial meltdown – the financial sector.
True, the Financial Select Sector SPDR ETF (NYSEArca: XLF) is humming higher, but the SPDR S&P 500 Bank ETF (NYSEArca: KBE) is not.
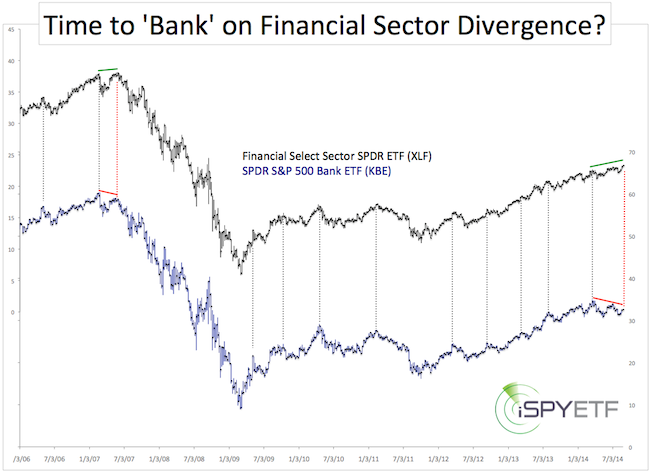
To be exact, the KBE bank ETF is trading 6.5% below its March high while the XLF financial ETF has already edged out new recovery highs. That’s unusual.
The chart below shows that since its inception, KBE has confirmed every significant new XLF high (dashed gray lines). Only two exceptions (dashed red lines) created a bearish divergence:
- May 2007
- August 2014

Although we don’t need the aid of a chart to remind us of what happened post May 2007, the chart tells us anyway.
Obviously, it would be premature to bunker up and batten down the hatches based on a sample size of one.
Even if the 2007 scenario is playing out again, it’s too early to pencil in a market crash in your 2014 trading calendar. Why?
- There’s a grace period between the XLF high and the final S&P 500 (NYSEArca: SPY) high. In 2007, the S&P 500 rally continued five months after XLF topped and the market didn’t enter free fall territory until a year after XLFs all-time high.
- XLF just saw a technical breakout. This looks bullish on the chart until proven otherwise. However, the breakout mimics a prior pattern that failed (see “XLF Breaks above Resistance to New 6-year High” for more details).
A small detail many have already forgotten is that the S&P 500 dropped nearly 12% in July/August 2007 just before shooting to its final October hurray.
A similar pullback now would certainly make this financial sector divergence even more intriguing.
Simon Maierhofer is the publisher of the Profit Radar Report. The Profit Radar Report presents complex market analysis (S&P 500, Dow Jones, gold, silver, euro and bonds) in an easy format. Technical analysis, sentiment indicators, seasonal patterns and common sense are all wrapped up into two or more easy-to-read weekly updates. All Profit Radar Report recommendations resulted in a 59.51% net gain in 2013.
Follow Simon on Twitter @ iSPYETF or sign up for the FREE iSPYETF Newsletter to get actionable ETF trade ideas delivered for free.
