Inquiring minds are investigating job creation. Here is the question at hand: What age group or age groups get the bulk of the jobs?
ZeroHedge claims No Country For Young Workers: Only Americans 55 And Older Found Jobs In March.
We first showed back in October 2012 that in America, courtesy of the Fed’s micro-mismanagement of everything, the labor force has been turned upside down, and the only jobs being created are those for aged workers, Americans 55 and over. The reason is two-fold: with savings rates at zero, Americans who were on the verge of retiring found that the fruit of their labor was worth nothing under ZIRP (and may well be punished under the upcoming NIRP) as their savings (and fixed income investments) generate zero interest income, while young Americans would rather stay in college by the millions funded generously by trillions in Uncle Sam student loans.
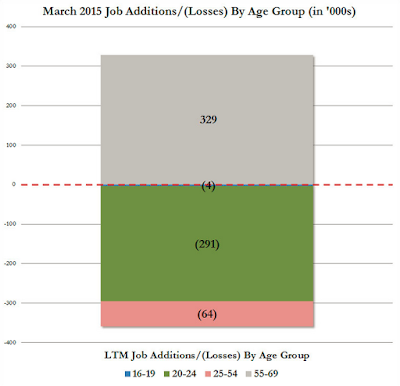
All of this was on full display in today’s jobs number, which while disappointing wildly based on Establishment survey data, was even worse based on the Household survey where only 34,000 people found jobs in March. But it was the age breakdown that was the stunner, and it can be seen best in the chart below.
In short: America continues to be a country where there are only jobs for old men, those 55 and older, who saw a 329,000 increase in jobs in the past month. Every other age group saw job losses!
March Job Losses by Age Group
That was one of the charts ZeroHedge posted. Technically there is be nothing wrong with the chart, assuming the numbers are accurate.
However, the chart does not show where gains and losses are in a realistic manner.
A couple charts of my own will explain why.
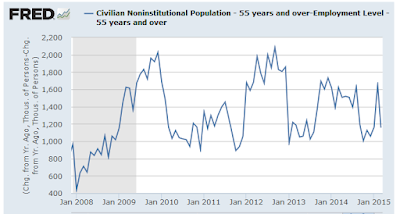
55 and Over Employment
Note the volatility in this series. Last month employment in the 55 and over category declined by 187,000. This month it rose by 329,000.
Is Age Group 55 and Older Gaining or Losing Employment?
Quick question: Judging from the above chart, is age group 55 losing or gaining or losing employment?
The correct answer is “relative to population growth, it’s impossible to tell!“
The only realistic way to prove or disprove ZeroHedge’s claim is to factor in age demographics. The proper way to do this is compare the growth in population of an age group vs. growth of employment in the same age group.
Let’s chart this for two age groups.
- Civilian Population 55 and Over
- Civilian Population 25-54
To chart relative employment gains or losses I take the population change from year ago and subtract employment levels from a year ago.
- In periods where growth in population exceeds growth in employment the charts are in positive territory.
- In periods where growth in employment exceeds growth in population the charts are in negative territory.
55 and Over Population Minus Employment Year-Over-Year
For age group 55 and over, the growth in population far exceeds growth in employment for every year-over-year comparison. This demographic is “not” adding employment.
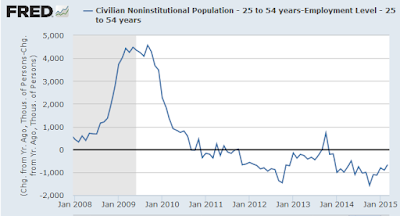
25-54 Population Minus Employment Year-Over-Year
For age group 25-54, year-over-year gains in employment were greater than population gains every month since November 2011 except for September and October of 2013.
This is by no means a strong recovery. It simply means the ZeroHedge statement “We first showed back in October 2012 that in America, courtesy of the Fed’s micro-mismanagement of everything, the labor force has been turned upside down, and the only jobs being created are those for aged workers, Americans 55 and over.” is incorrect.
Let’s do the exercise again month-over-month. For this exercise we need to use seasonally adjusted numbers for employment.
There are no seasonal adjustments for population numbers, you are either alive and counted or dead and not counted, except perhaps for voting purposes in certain places.
55 and Over Population Minus Employment Month-Over-Month
March is one of about 20 months in this series where employment in age group 55 rose relative to population. It is opposite to the long-term trend, yet common enough to be meaningless. One month proves nothing.
25-54 Population Minus Employment Month-Over-Month
Note the purple squares for each year. In years where employment rises faster than population, the bulk of the area will be below the zero line (i.e. negative numbers).
Let’s do a sum of the months.
Age Group 25-54 Population Minus Employment 2008-2014
| Year | Population Growth – Employment Growth | Monthly Average |
|---|---|---|
| 2008 | 2,708,000 | 225,667 |
| 2009 | 3,476,000 | 289,667 |
| 2010 | -404,000 | -33,667 |
| 2011 | -672,000 | -56,000 |
| 2012 | -731,000 | -60,917 |
| 2013 | -187,000 | -15,583 |
| 2014 | -1,107,000 | -92,250 |
Age Group 25-54 Net Gains and Losses
In 2008 the average net monthly loss in employment was 225,667.
In 2009 the average net monthly loss in employment was 289,000.
In 2013 the average net monthly gain in employment was a mere 15,583.
The only strong year in the set is 2014 where net employment gains relative to population growth averaged 92,250 per month. Once again, negative numbers show employment growth relative to population growth.
In 2013, relative to population growth, there was only a tiny gain in employment. The unemployment rate fell dramatically thanks to people dropping out of the labor force.
That should put in context the much hyped monthly job gains over the last year.
Age Group 55+ Population Minus Employment 2008-2014
| Year | Population – Employment | Average |
|---|---|---|
| 2008 | 984,000 | 82,000 |
| 2009 | 2,117,000 | 176,417 |
| 2010 | 877,000 | 73,083 |
| 2011 | 1,049,000 | 87,417 |
| 2012 | 1,847,000 | 153,917 |
| 2013 | 1,735,000 | 144,583 |
| 2014 | 1,054,000 | 87,833 |
Relative to growth in population there has not been a single year that shows age group 55+ has gained employment. Indeed, the best year in the lot was 2010 where population-adjusted employment fell an average of 73,083 per month.
The following tables show the huge gains every year retirement age groups 60-64 and 65+.
Age group 60-64 consists of people who may want to retire. Age group 65 and older consists of people who probably want to retire.
Population Growth 60-64 (numbers in thousands)
| Year | Jan | Feb | Mar | Apr | May | Jun | Jul | Aug | Sep | Oct | Nov | Dec |
|---|---|---|---|---|---|---|---|---|---|---|---|---|
| 2005 | 12719 | 12760 | 12890 | 12947 | 12988 | 13036 | 13036 | 12990 | 12986 | 12997 | 13076 | 13073 |
| 2006 | 13135 | 13128 | 13255 | 13299 | 13358 | 13327 | 13373 | 13409 | 13450 | 13629 | 13713 | 13736 |
| 2007 | 13841 | 13875 | 14138 | 14175 | 14262 | 14352 | 14260 | 14424 | 14521 | 14623 | 14756 | 14842 |
| 2008 | 14866 | 14806 | 14833 | 14844 | 14782 | 14943 | 14983 | 15126 | 15267 | 15299 | 15373 | 15437 |
| 2009 | 15423 | 15516 | 15609 | 15605 | 15607 | 15714 | 15760 | 15846 | 15958 | 16007 | 16143 | 16279 |
| 2010 | 16297 | 16337 | 16398 | 16328 | 16443 | 16455 | 16495 | 16599 | 16737 | 16809 | 16986 | 17139 |
| 2011 | 17134 | 17144 | 17124 | 17162 | 17161 | 17294 | 17368 | 17354 | 17465 | 17506 | 17582 | 17513 |
| 2012 | 17815 | 17745 | 17650 | 17705 | 17631 | 17632 | 17639 | 17774 | 17779 | 17841 | 17919 | 17790 |
| 2013 | 17847 | 17854 | 17830 | 17904 | 17967 | 18056 | 18118 | 18271 | 18151 | 18126 | 18241 | 18170 |
| 2014 | 18293 | 18376 | 18394 | 18441 | 18475 | 18449 | 18522 | 18472 | 18593 | 18664 | 18729 | 18873 |
| 2015 | 18848 | 18919 | 18973 |
Population Growth 65+ (numbers in thousands)
| Year | Jan | Feb | Mar | Apr | May | Jun | Jul | Aug | Sep | Oct | Nov | Dec |
|---|---|---|---|---|---|---|---|---|---|---|---|---|
| 2005 | 34888 | 34933 | 34955 | 34982 | 35014 | 35033 | 35084 | 35149 | 35168 | 35206 | 35201 | 35208 |
| 2006 | 35362 | 35395 | 35461 | 35509 | 35554 | 35607 | 35625 | 35671 | 35733 | 35797 | 35804 | 35841 |
| 2007 | 35946 | 35956 | 36013 | 36048 | 36133 | 36207 | 36234 | 36290 | 36351 | 36444 | 36511 | 36603 |
| 2008 | 36810 | 36866 | 36925 | 37002 | 37054 | 37110 | 37165 | 37247 | 37318 | 37437 | 37481 | 37522 |
| 2009 | 37677 | 37709 | 37782 | 37861 | 37905 | 37967 | 37979 | 38059 | 38143 | 38232 | 38297 | 38362 |
| 2010 | 38401 | 38444 | 38499 | 38573 | 38588 | 38668 | 38708 | 38791 | 38877 | 38906 | 38973 | 39045 |
| 2011 | 39383 | 39402 | 39450 | 39478 | 39488 | 39575 | 39635 | 39778 | 39937 | 40045 | 40208 | 40364 |
| 2012 | 41085 | 41231 | 41379 | 41481 | 41601 | 41751 | 41876 | 42082 | 42278 | 42413 | 42557 | 42695 |
| 2013 | 42724 | 42851 | 42986 | 43071 | 43192 | 43307 | 43453 | 43607 | 43710 | 43887 | 43998 | 44155 |
| 2014 | 44265 | 44402 | 44561 | 44638 | 44787 | 44875 | 45002 | 45116 | 45249 | 45398 | 45534 | 45685 |
| 2015 | 45780 | 45936 | 46091 |
Retirement Age Perspective
- Since March 2008, the age 60-64 demographic rose by 4,140,000.
- Since March 2008, the age 65+ demographic rose by 9,166,000.
- Since March 2008, the 60+ demographic rose by 13,306,000.
It is reasonable to assume some of those in age group 60-64 retired. It is reasonable to assume most of those older than 65 did retire.
Yet, retirement alone does not account for the huge drop in the unemployment rate. I will prove that in a followup post with a discussion of “core unemployment”.
Mike “Mish” Shedlock
http://globaleconomicanalysis.blogspot.com


