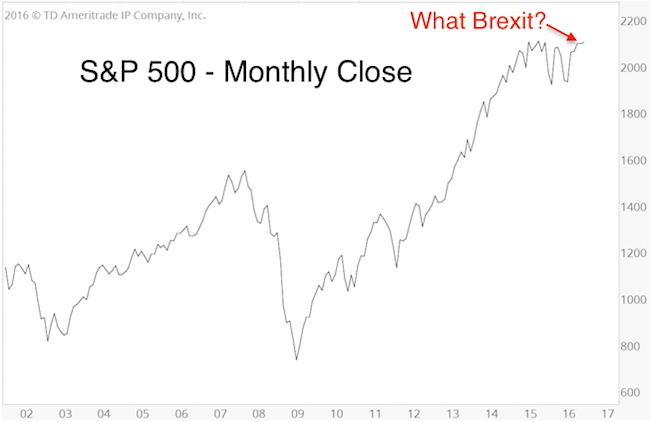
Brexit! What Brexit? The Brexit reaction doesn’t even register on the monthly S&P 500 chart. ‘A tempest in the teapot’ as the British would say. This is yet another example why we do not focus (and sometimes ignore) news events.

The Brexit vote did cause undeniable ripple effects, but only temporarily. It’s time to tune out the noise and stop using Brexit as excuse or cause for everything that happens.
As the headlines below show, Brexit can’t be savior and scapegoat at the same time:
- Morningstar: Stocks Climb as Investors Shake off Brexit Concerns
- MarketWatch: US Stocks Open Lower as Brexit-Inspired Selloff Continues
- MarketWatch: Dow Ends up 270 Points as Brexit Fears Abate
- Morningstar: Stocks fall as Brexit Worries Resurface
Chart Analysis
The June 19 Profit Radar Report expected a temporary drop to 2,002 – 1,928 followed by a resumption of the rally. The ideal down side target was 1,970 – 1,925 (original chart is available here).
Barron’s rates iSPYETF as a “trader with a good track record.” Click here for Barron’s assessment of the Profit Radar Report.
The structure of the post-Brexit selloff confirmed that the decline would turn out to be temporary. In a section titled “Chart Gaps and Major Market Tops” the June 26 Profit Radar Report noted open chart gaps and stated the following:
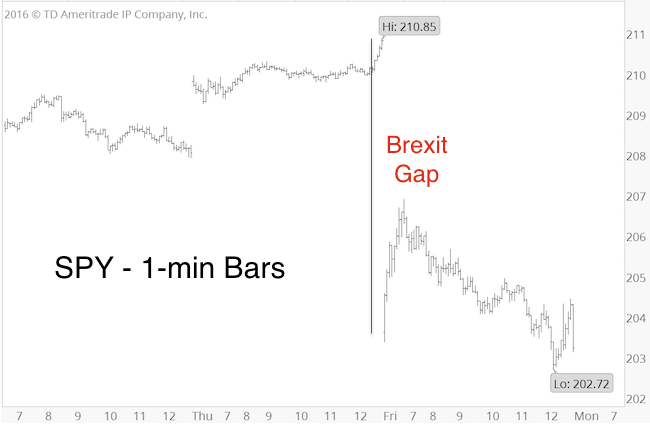
“Following a tumultuous night, the SPDR S&P 500 ETF (SPY) opened Friday 3.42% lower than Thursday’s close (see chart). Since the inception of SPY (1/22/1993), there’ve only been 7 bigger gap down opens, and a total of 11 opening gaps with losses in excess of 3%. Five days later, the S&P traded higher 10 out of 11 times with an average post gap gain of 4.96%.
One of the reasons we continuously anticipated new all-time highs in recent years were open chart gaps left near the top. This is again the case now. There are open gaps at 2,104.57 and 2,117.96”

On June 27, the S&P fell as low as 1,991.68. This was in the general target zone, but short of our ideal target zone at 1,970 – 1,925. Nevertheless, the June 27 Profit Radar Report stated that: “two separate price patterns suggest a bounce is brewing.”
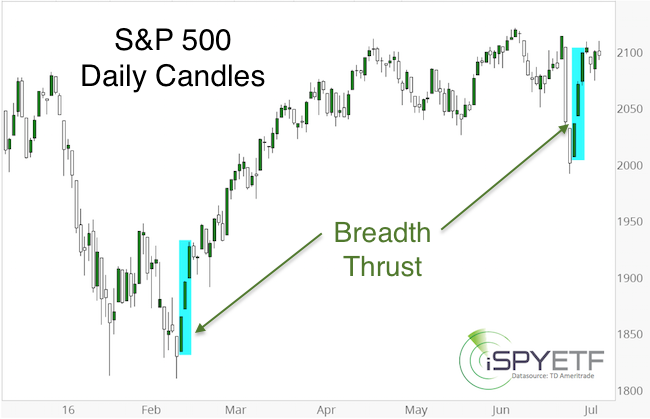
Initially, we anticipated this bounce to be choppy and relapse into the ideal 1,970 – 1,925 zone, but as the June 29 Profit Radar Report brought out, “this bounce has been stronger (in terms of breadth) than it was ‘supposed’ to be. Preliminary data suggests that the S&P may be experiencing a breadth thrust similar to what we saw in mid-February (see February 21 PRR). Based on the strong kick off from Monday’s low, we must consider the possibility that a more lasting low is already in.”
The February kickoff analysis, originally published in the February 21 Profit Radar Report, is available here: 2016 Bear Market Risk is Zero Based on this Rare but Consistent Pattern

Summary
Last week’s kickoff rally suggested a short-term digestive lull (with initial support near 2,070) followed by higher prices eventually. However, we never put all our eggs in our basket. No matter how compelling last week’s breadth thrust is, we are waiting for price to meet our parameters (buy triggers) before going long.
Until this happens, we may see more choppiness, and even more down side (although unlikely). Continued updates are available via the Profit Radar Report.
Simon Maierhofer is the founder of iSPYETF and the publisher of the Profit Radar Report. Barron’s rated iSPYETF as a “trader with a good track record” (click here for Barron’s profile of the Profit Radar Report). The Profit Radar Report presents complex market analysis (S&P 500, Dow Jones, gold, silver, euro and bonds) in an easy format. Technical analysis, sentiment indicators, seasonal patterns and common sense are all wrapped up into two or more easy-to-read weekly updates. All Profit Radar Report recommendations resulted in a 59.51% net gain in 2013, 17.59% in 2014, and 24.52% in 2015.
Follow Simon on Twitter @ iSPYETF or sign up for the FREE iSPYETF Newsletter to get actionable ETF trade ideas delivered for free.
