Three year ago, I wrote: Census Bureau: Largest 5-year Population Cohort is now the “20 to 24” Age Group.
Last year I followed up with Largest 5-year Population Cohorts are now “20 to 24” and “25 to 29” and U.S. Demographics: Ten most common ages in 2010, 2015, 2020, and 2030.
Note: For the impact on housing, also see: Demographics: Renting vs. Owning
Last week the Census Bureau released the population estimates for 2016, and I’ve updated the table from the previous post (replacing 2015 with 2016 data).
The table below shows the top 11 cohorts by size for 2010, 2016 (released this month), and Census Bureau projections for 2020 and 2030.
By the year 2020, 8 of the top 10 cohorts will be under 40 (the Boomers will be fading away), and by 2030 the top 11 cohorts will be the youngest 11 cohorts (the reason I included 11 cohorts).
There will be plenty of “gray hairs” walking around in 2020 and 2030, but the key for the economy is the population in the prime working age group is now increasing.
This is very positive for housing and the economy.
| Population: Largest 5-Year Cohorts by Year | ||||
|---|---|---|---|---|
| Largest Cohorts |
2010 | 2016 | 2020 | 2030 |
| 1 | 45 to 49 years | 25 to 29 years | 25 to 29 years | 35 to 39 years |
| 2 | 50 to 54 years | 20 to 24 years | 30 to 34 years | 40 to 44 years |
| 3 | 15 to 19 years | 55 to 59 years | 35 to 39 years | 30 to 34 years |
| 4 | 20 to 24 years | 50 to 54 years | Under 5 years | 25 to 29 years |
| 5 | 25 to 29 years | 30 to 34 years | 55 to 59 years | 5 to 9 years |
| 6 | 40 to 44 years | 15 to 19 years | 20 to 24 years | 10 to 14 years |
| 7 | 10 to 14 years | 45 to 49 years | 5 to 9 years | Under 5 years |
| 8 | 5 to 9 years | 35 to 39 years | 60 to 64 years | 15 to 19 years |
| 9 | Under 5 years | 10 to 14 years | 15 to 19 years | 20 to 24 years |
| 10 | 35 to 39 years | 5 to 9 years | 10 to 14 years | 45 to 49 years |
| 11 | 30 to 34 years | Under 5 years | 50 to 54 years | 50 to 54 years |
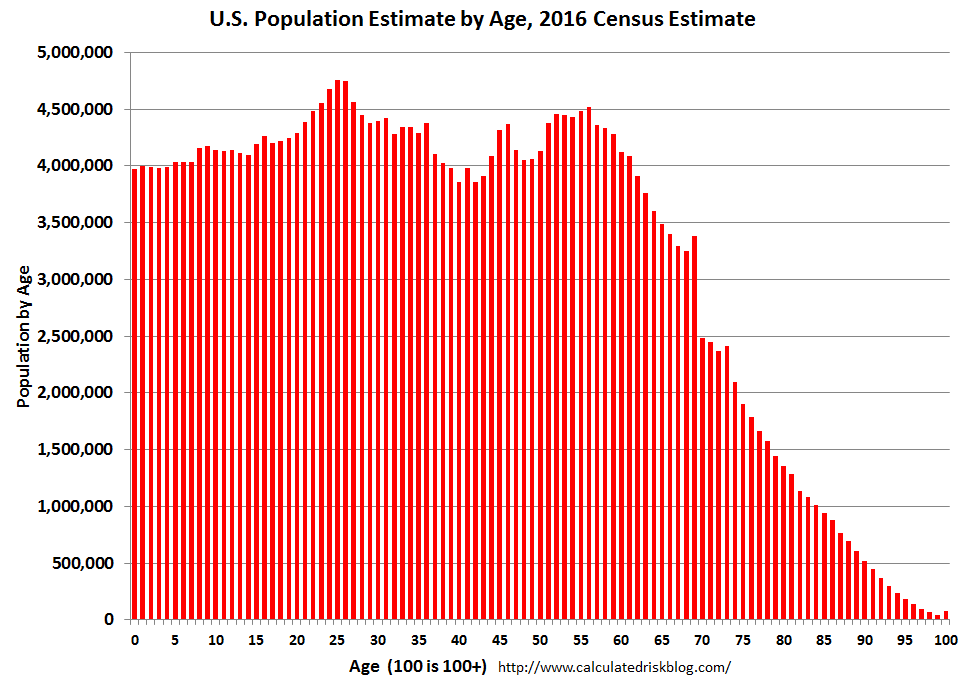
Click on graph for larger image.
This graph, based on the 2016 population estimate, shows the U.S. population by age in July 2016 according to the Census Bureau.
Note that the largest age groups are all in their mid-20s.
And below is a table showing the ten most common ages in 2010, 2016, 2020, and 2030 (projections are from the Census Bureau).
Note the younger baby boom generation dominated in 2010. By 2016 the millennials are taking over. And by 2020, the boomers are off the list.
My view is this is positive for both housing and the economy, especially in the 2020s.
| Population: Most Common Ages by Year | ||||
|---|---|---|---|---|
| 2010 | 2016 | 2020 | 2030 | |
| 1 | 50 | 25 | 29 | 39 |
| 2 | 49 | 26 | 30 | 40 |
| 3 | 20 | 24 | 28 | 38 |
| 4 | 19 | 27 | 27 | 37 |
| 5 | 47 | 23 | 31 | 36 |
| 6 | 46 | 56 | 26 | 35 |
| 7 | 48 | 55 | 32 | 41 |
| 8 | 51 | 22 | 25 | 30 |
| 9 | 18 | 52 | 35 | 34 |
| 10 | 52 | 28 | 34 | 33 |