Back in January 2020, I noticed a tug-of-war between extreme optimism (bearish for stocks) and bullish market momentum. As so often, euphoria was followed by dispair.
The pandemic has not left, but stock market euphoria is back, and this time optimism it’s clashing against internal stock market strength. Welcome to tug-of-war 2.0. Will sentiment cause the stock market to spiral down again?
Extreme Investor Optimism
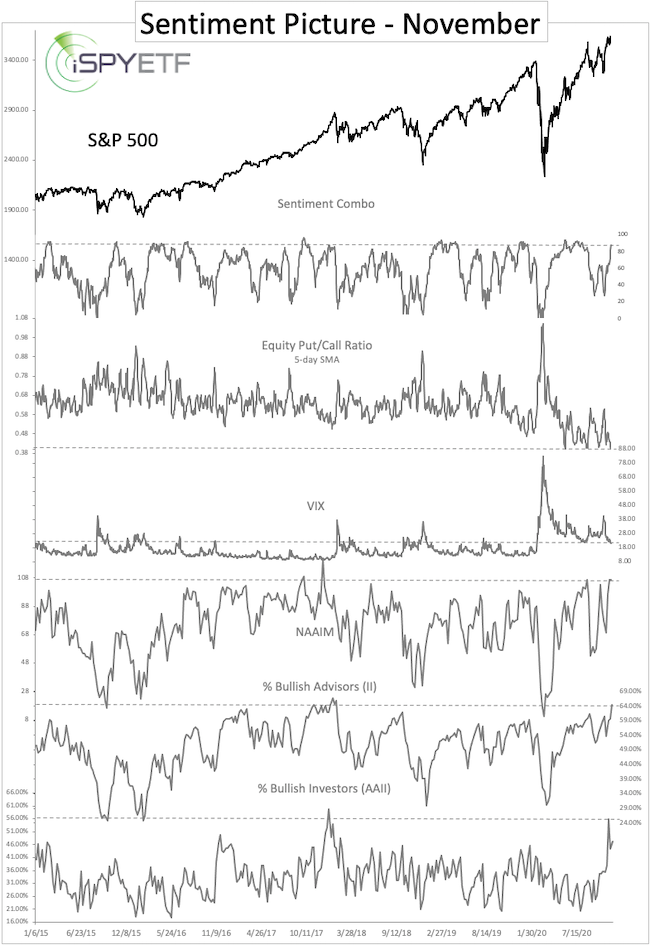
The chart below shows just a few of the dozens of investor sentiment gauges I follow regularly. Aside from the VIX, all of them are in the extreme optimism danger zone.
130-year Trend Line Resistance
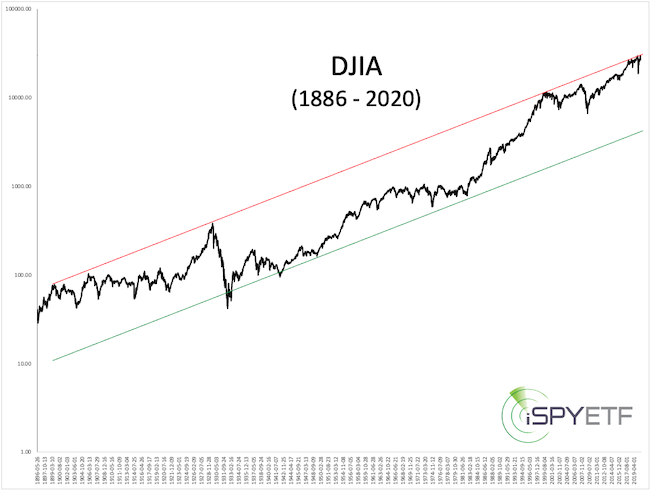
In addition to sentiment extremes, the Dow Jones Industrial Average (DJIA) is once again bumping against a 130-year old trend line, like it did in February 2020.
Based on those two factors, risk is very high. But, there are more than just 2 factors to consider.
Internal Strength
Various Profit Radar Report noticed historically extreme bouts of buying pressure after the March 2020 low. The forward performance trackers at the bottom of the studies highlight why studies from earlier this year are still applicableL
- June 10, 2020 Profit Radar Report:
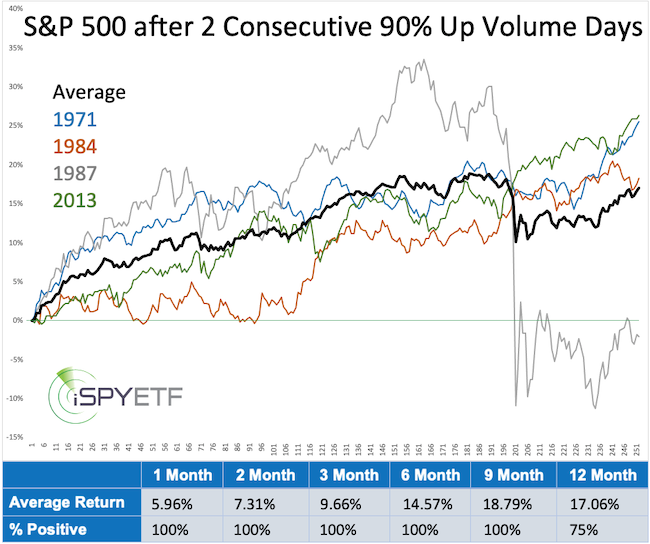
“Bullish study: On June 5 and 8, 90% of NYSE trading volume went into advancing stocks. Since 1970, there were only 4 other times that saw 2 consecutive 90% up days. The chart below plots the forward performance of those instances (forward returns and odds of positive returns are shown via the bottom panel).“
Barron’s rates iSPYETF as “trader with a good track record” and Investor’s Business Daily says: “When Simon says, the market listens.” Find out why Barron’s and IBD endorse Simon Maierhofer’s Profit Radar Report
- July 12, 2020 Profit Radar Report:
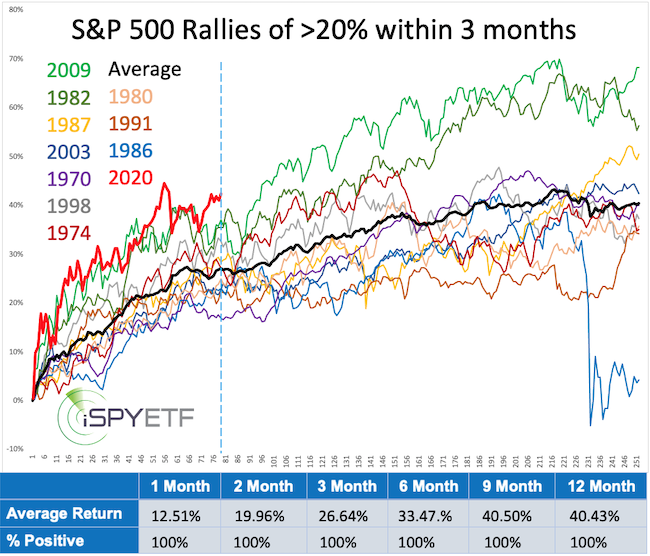
“Below is a look at the fastest S&P 500 rallies (1970 – today). To qualify for inclusion, price had to rise at least 20% in less than 3 months. This happened 12 other times (twice in 1982 and 2009, but only the first instances of those years are shown via chart below).
The 2020 rally (red graph) has been by far the quickest and strongest. The dashed blue line marks ‘today’ (78 days into the rally). Here are some key takeaways:
– The S&P is currently up 42.35%, which is already above the 40.43% average 12-month return.
– The strong rallies of 1982 and 2009 took a breather during the summer.
– With the exception of 1986, the S&P 500’s 12 month return was higher than the day 78 return every time.”
- August 9, 2020 Profit Radar Report:
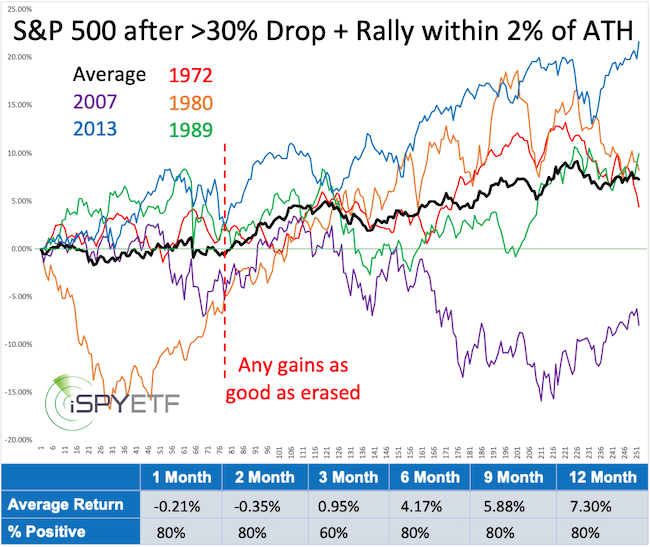
“Since 1970, the S&P 500 dropped more than 30% and thereafter rallied within 2% of its all-time high 5 other times. On average, the roundtrip from ATH to within 2% of ATH after a 30% decline took 60 months. This time it took only 6 months.
The chart below shows the forward performance of the S&P 500 after it first came within 2% of its prior ATH (after a >30% decline). Aside from the 1980 rally, future returns were generally positive, but every time, any gains were either erased or as good as erased about 4 months later (dashed red line).“
- November 15, 2020 Profit Radar Report:
“Various recent PRRs noted a resurgence of buying pressure (i.e. October 11 PRR. Not to beat a dead horse, but here is one more: On November 2, 3, 5, 9, 80% or more of NYSE volume went into rising stocks. This was the 10th time since 1970 that 4 of 6 days saw >80% up volume (11/13/20 was another >80% up volume day).
The forward performance after the prior instances is plotted out below (2010 and 2011 actually hosted 2 of 4 of 6 80% up days events, but only the forward performance for the respective second event is shown). Over the next 4 months, 4 of 10 instances showed losses of 7-11%, but 6, 9 and 12 months later the S&P 500 was up every time.”
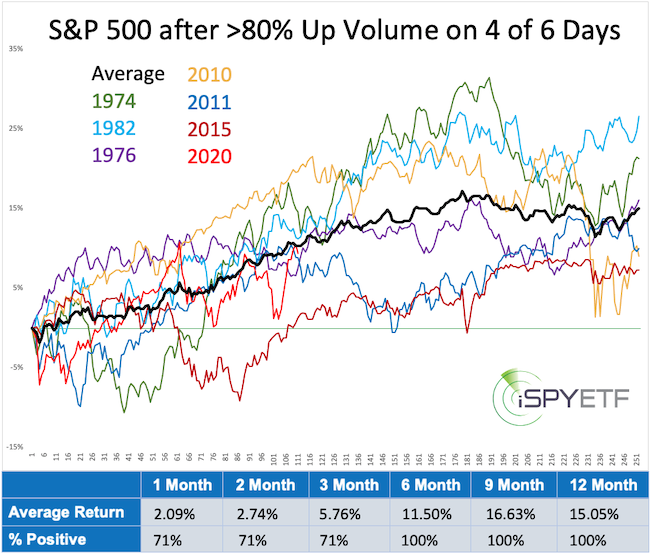
The performance tracker at the bottom of each study provides forward returns for the next 1, 2, 3, 6, 9, 12 months. The Risk/Reward Heat Map captures the data and provides a visual heat map of month by month risk vs reward for the next year.
Conclusion
Normally the combination of historic investor optimism while stocks are pressing against long-term resistance is a recipe for disaster. But, as the above studies show, strong stock market internals are likely to over-power other risk factors if the main indexes break and stay above resistance.
Become the best informed investor you know by reading the Profit Radar Report.