Earlier I posted some questions for this year: Ten Economic Questions for 2013. I’ll try to add some thoughts, and maybe some predictions for each question.
Note: Here is a review of my 2012 Forecasts
8) Housing Inventory: Over the last few years, we’ve seen a dramatic plunge in existing home inventory. Will inventory bottom in 2013?
This is an interesting question and the lack of supply is one of the reasons house prices were up about 6% in 2012. Economist Jed Kolko at Trulia wrote about inventory last month:
The key question in 2013, though, is whether prices will rise enough so that for-sale inventory–which has fallen 43% nationally since the summer of 2010–will hit bottom and start expanding again. … Rising prices should lead to more inventory, for two reasons: (1) rising prices encourage new construction, and (2) rising prices encourage some homeowners to sell.
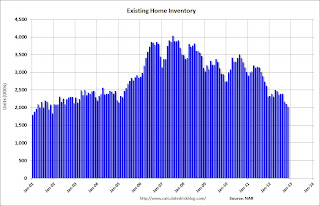
This graph shows nationwide inventory for existing homes through November.
 Click on graph for larger image.
According to the NAR, inventory declined to 2.03 million in November down from 2.11 million in October. This is the lowest level of inventory since December 2001. Inventory is not seasonally adjusted, and usually inventory decreases from the seasonal high in mid-summer to the seasonal lows in December and January as sellers take their homes off the market for the holidays.
If we see the usually seasonal decline in December (not reported yet) and January, then NAR reported inventory will probably fall to the 1.80 to 1.85 million range. That would be the lowest level since January 2001.
Important: The NAR reports active listings, and although there is some variability across the country in what is considered active, most “contingent short sales” are not included. When we compare inventory to earlier periods, we need to remember there were essentially no “short sale contingent” listings prior to 2006.
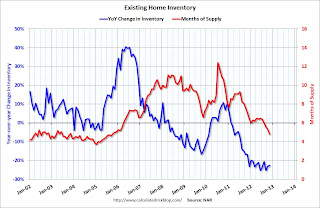
 The second graph shows the year-over-year (YoY) change in reported existing home inventory and months-of-supply. Since inventory is not seasonally adjusted, it really helps to look at the YoY change. Note: Months-of-supply is based on the seasonally adjusted sales and not seasonally adjusted inventory.
Inventory decreased 22.5% year-over-year in November from November 2011. This was the 21st consecutive month with a YoY decrease in inventory.
Months of supply declined to 4.8 months in November. This is the lowest level based on months-of-supply since September 2005.
Whenever I talk with real estate agents, I ask why they think inventory is so low. A common answer is that people don’t want to sell at the bottom. In a market with falling prices, sellers rush to list their homes, and inventory increases. But if sellers think prices have bottomed, then they believe they can be patient, and inventory declines. Another reason is that many homeowners are “underwater” on their mortgage and can’t sell.
Note: the Mortgage Debt Relief Act of 2007 was extended for another year. This means homeowners can sell their homes “short” (for less than they owe if the lender approves) and they don’t have to pay taxes on the debt forgiveness. This will keep the short sale market active in 2013.
If prices increase enough then some of the potential sellers will come off the fence, and some of these underwater homeowners will be able to sell. It might be enough for inventory to bottom in 2013.
Right now my guess is active inventory will bottom in 2013, probably in January. At the least, the rate of year-over-year inventory decline will slow sharply. It will be very interesting to see how much inventory comes on the market during the spring selling season!
Earlier:
• Question #9 for 2013: How much will Residential Investment increase?
• Question #10 for 2013: Europe and the Euro