A few key points:
• Housing starts increased 28.1% in 2012 (initial estimate). This is a solid year-over-year increase, and residential investment is now making a positive contribution to GDP growth.
• Even after increasing 28% in 2012, the 780 thousand housing starts this year were the fourth lowest on an annual basis since the Census Bureau started tracking starts in 1959 (the three lowest years were 2009 through 2011). This was also the fourth lowest year for single family starts since 1959.
• Starts averaged 1.5 million per year from 1959 through 2000. Demographics and household formation suggests starts will return to close to that level over the next few years. That means starts will come close to doubling from the 2012 level.
• Residential investment and housing starts are usually the best leading indicator for economy. Note: Housing is usually a better leading indicator for the US economy than manufacturing, see: Josh Lehner’s The Handoff – Manufacuturing to Housing. Nothing is foolproof as a leading indicator, but this suggests the economy will continue to grow over the next couple of years.
The following table shows annual starts (total and single family) since 2005:
| Housing Starts (000s) | ||||
|---|---|---|---|---|
| Total | Change | Single Family | Change | |
| 2005 | 2,068.3 | — | 1,715.8 | — |
| 2006 | 1,800.9 | -12.9% | 1,465.4 | -14.6% |
| 2007 | 1,355.0 | -24.8% | 1,046.0 | -28.6% |
| 2008 | 905.5 | -33.2% | 622.0 | -40.5% |
| 2009 | 554.0 | -38.8% | 445.1 | -28.4% |
| 2010 | 586.9 | 5.9% | 471.2 | 5.9% |
| 2011 | 608.8 | 3.7% | 430.6 | -8.6% |
| 2012 | 780.0 | 28.1% | 535.5 | 24.4% |
Here is an update to the graph comparing multi-family starts and completions. Since it usually takes over a year on average to complete a multi-family project, there is a lag between multi-family starts and completions. Completions are important because that is new supply added to the market, and starts are important because that is future new supply (units under construction is also important for employment).
These graphs use a 12 month rolling total for NSA starts and completions.
 Click on graph for larger image.
The blue line is for multifamily starts and the red line is for multifamily completions.
The rolling 12 month total for starts (blue line) has been increasing steadily, and completions (red line) is lagging behind – but completions will follow starts up (completions lag starts by about 12 months).
This means there will be an increase in multi-family deliveries next year, but still well below the 1997 through 2007 level of multi-family completions.
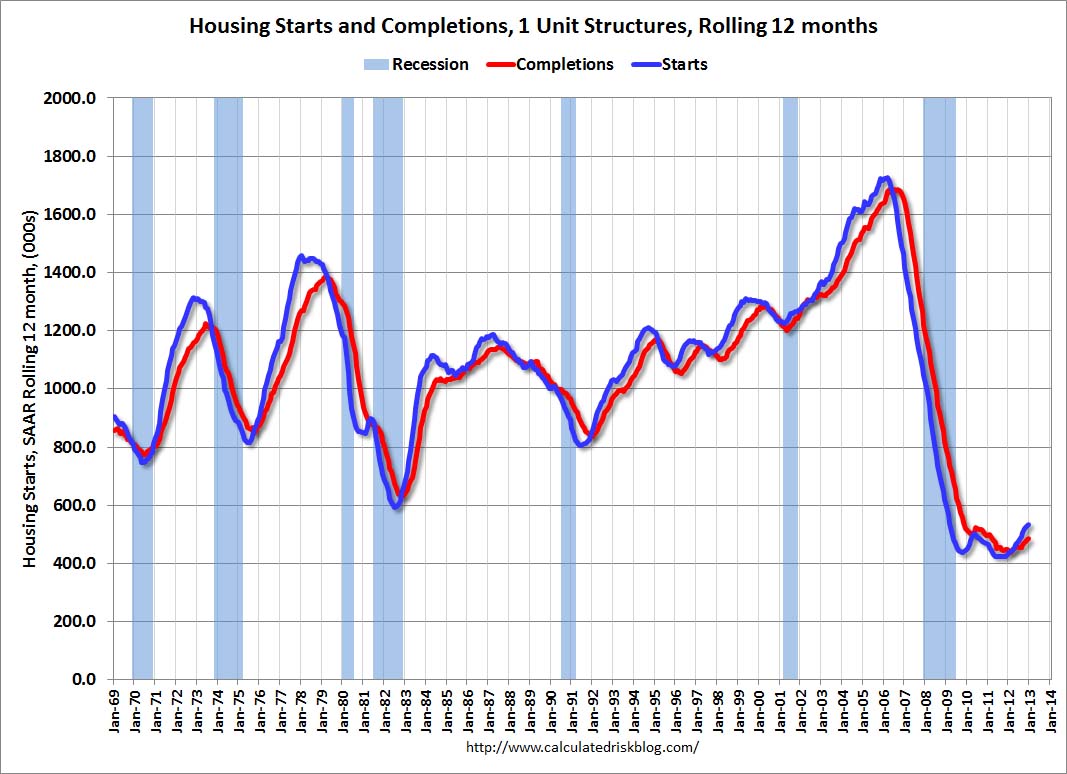 The second graph shows single family starts and completions. It usually only takes about 6 months between starting a single family home and completion – so the lines are much closer. The blue line is for single family starts and the red line is for single family completions.
Starts are moving up, but the increase in completions has just started. Usually single family starts bounce back quickly after a recession, but not this time because of the large overhang of existing housing units.
Note the low level of single family starts and completions. The “wide bottom” was what I was forecasting several years ago, and now I expect several years of increasing single family starts and completions.