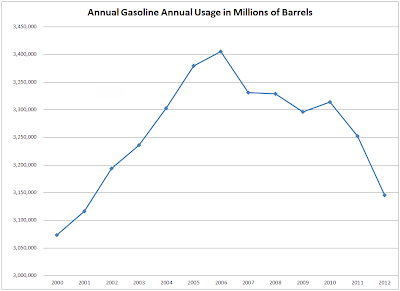
Inquiring minds are once again taking a look at annual gasoline sales in the United States. Reader Tim Wallace provides the following chart for discussion.
click on chart for sharper image
Data is from the US Energy Information Administration (EIA) Weekly Petroleum Report.
Tim writes …
Hello Mish
Data for the chart is taken from the weekly reports I like to use, and its trend is accurate.
The current downturn happened back in 2007 in gasoline, and it is one of the things I saw that got me out of the market. I cannot see an improved economy from these numbers, and the numbers also cannot be explained by “higher mileage” vehicles – the impact would be some, but not as major as we see here, with usage numbers now back to 2001 levels.
The drops in the past two years can only be explained by less driving, which also would mean less wear and tear on the roads and therefore less spending.
Interestingly, I have seen a lot of repaving of roads that are perfectly serviceable. So why pave them?
And talking about paying for things that you use … You and I both know that the highways North of the Mason-Dixon line eat up much more tax dollars as the weather in winter tears them apart. Therefore y’all up there should have a much higher fee than those in the South here who use much less of the federal spending pie!
Just sayin’!
Tim
Hi Tim. Thanks for reminding those of us in the great state of Illinois that we should be paying even more for our services! I am sure governor Pat Quinn would be more than happy to oblige overpaid unions by hiking our taxes more.
Kidding aside, Tim was referring to my post ObamaMiles Tax Coming Soon; Transportation “Trust Fund” Broke; Scheme to Boost Taxes 250%; Mindless Possibilities
Readers may also wish to consider European Car Demand Near 20-Year Low; Peugeot Workers Shut Down French Plant; GM Loses Global Car Sales Lead to Toyota Once Again
Mike “Mish” Shedlock
http://globaleconomicanalysis.blogspot.com
“Wine Country” Economic Conference Hosted By Mish
Click on Image to Learn More

