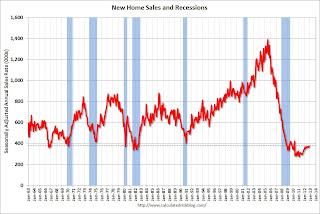
On Friday, the Census Bureau will release the New Home Sales report for December. It looks like sales will be up close to 20% in 2012, the first year-over-year increase since 2005.
This table shows the annual sales rate for the last eight years (2012 estimated).
| Annual New Home Sales | ||
|---|---|---|
| Year | Sales (000s) | Change in Sales |
| 2005 | 1,283 | 6.7% |
| 2006 | 1,051 | -18.1% |
| 2007 | 776 | -26.2% |
| 2008 | 485 | -37.5% |
| 2009 | 375 | -22.7% |
| 2010 | 323 | -13.9% |
| 2011 | 306 | -5.3% |
| 20121 | 367 | 19.9% |
| 1 Estimate for 2012 | ||
Even with the sharp increase in sales, 2012 will still be the third lowest year for new home sales since the Census Bureau started tracking sales in 1963. The two lowest years were 2010 and 2011.
A key question looking forward is how much sales will increase over the next few years. My initial guess was sales would rise to around 800 thousand per year, but others think the peak may be closer to 700 thousand.
Note: For 2013, estimates are sales will increase to around 450 to 460 thousand, or another 22% to 25% on an annual basis.
 For the period 1980 through 2000, new homes sales averaged 664 thousand per year, with peaks at 750 thousand in 1986 (annual) and over 800 thousand in the late ’90s – and two deep “busts” in the early ’80 and early ’90s.
I think the demographics support close to 800 thousand per year, but even if sales only rise to the average of 664 thousand for the ’80s and ’90s, sales would still increase over 80% from the 2012 level.
For now I’ll stick with my guess that sales will more than double from the 2012 level in a few years – but even a lower level would be a significant contribution to GDP and employment growth over the next few years.