This is part three in a series of articles on jobs gained and lost since December 2007.
The first article was an interactive map from Tableau: Job Gains and Losses in the Recovery by Job Type
(Healthcare, Education, Mining, Construction, Finance, Real Estate,
etc).
The second article Job Gaining and Job Losing Industries 2007-2012 displayed data in an interesting pie chart fashion by Salil Mehta who has a blog on Statistical Ideas.
This article contains another look at the data, but focus is on jobs gained or lost in the recovery.
Data for all three posts is courtesy of Economic Modeling Specialists.
The recession ended in June of 2009, but the data I have is annual. Data in the following charts uses December of 2009 as a proxy for the start of the recovery. Once again, pie charts are by Salil Mehta.
Click on any chart for sharper image.
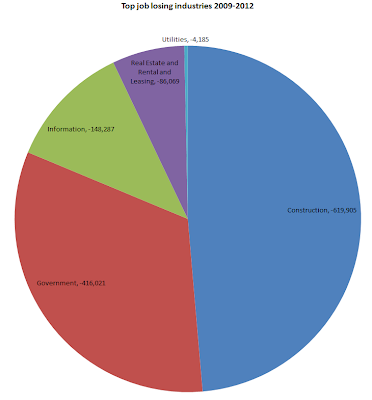
Top Losing Jobs in the Recovery
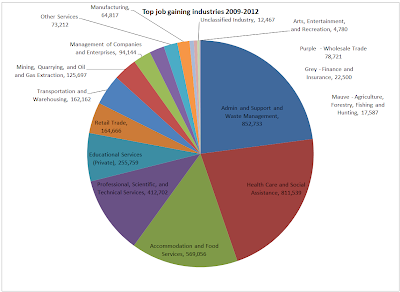
Top Gaining Jobs in the Recovery
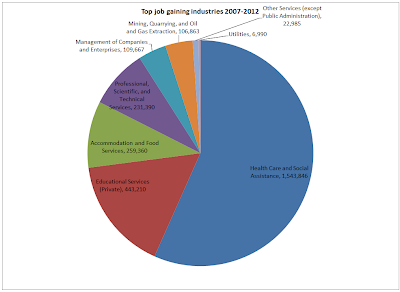
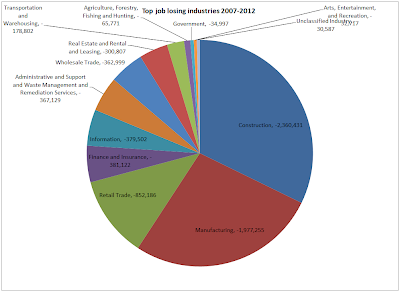
For comparison purposes here are the December 2007 thru December 2012 charts once again.
Job Gaining Industries 2007-2012
Job Losing Industries 2007-2012
Notes
- From 2007 thru 2012, 12 industries lost jobs.
- Since December of 2009, there were only 5 industries that lost jobs (and utilities only barely).
- As far as government jobs go, we can certainly afford to lose more.
- Information was a solid job loser every period
Gainers vs. Losers Analysis
If one listens to all the ads from for-profit schools as well as retraining hype from President Obama, one might actually think we need more IT training. As I have stated repeatedly, one cannot retrain a brick-layer into a programmer. Besides, there is a vast sea of skilled programmers (already trained) who do not have a job.
I don’t have a breakdown of healthcare and social services jobs, but the distinction between nurses, social workers and temporary care givers in terms of pay is without-a-doubt dramatic. I expect the economy added far more lower paying jobs than it did high-paying registered nursing jobs.
Accommodation and food service jobs certainly tend to be low-paying jobs. Indeed, many food service jobs are part-time only, with no benefits at all. I suspect most waste management jobs are low-paying jobs as well.
Compare the job gains in the recovery with job losses since 2007.
Construction, manufacturing, and information tend to be relatively high-pay jobs. In the period 2007-2012 the economy shed roughly 2.36 million construction jobs, 1.98 million manufacturing jobs, and 380,000 information jobs (a total of 4.69 million high-paying jobs). Note that construction and information lost jobs even in the recovery.
Simply put, the US shed more high-paying jobs in the recession than the economy gained jobs of any kind (high or low-paying) in the recovery.
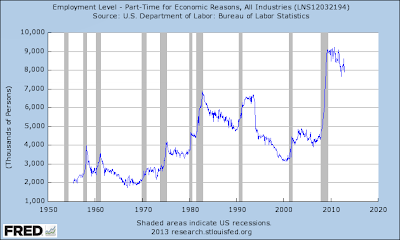
Involuntary Part-Time Employment
Part-Time Job Analysis
Its better to have a part-time job than no job. However, it’s certainly better to have a full-time job than a part-time job if one is seeking full-time employment.
Roughly an additional 5 million workers went to involuntary part-time employment during or shortly after the recession. Only about one million of those jobs are now full-time, not necessarily in the same field, or at the previous pay scale.
Unemployment Rate Artificially Low
The official unemployment number is artificially low because it does not include any of the following:
- Involuntary retirement to collect social security
- Involuntary part-time-employment
- Involuntarily education (e.g. kids remaining in school because there are no jobs)
My simple definition of unemployment is anyone who wants a jobs, is physically able to work a job, and does not have a job. By that definition, unemployment would certainly be North of 10%, and likely North of 11% (not even counting involuntary part-time employment).
Mike “Mish” Shedlock
http://globaleconomicanalysis.blogspot.com
I am hosting an economic conference in April, in Sonoma.
Please click on the image below for details.
“Wine Country” Economic Conference Hosted By Mish
Click on Image to Learn More
