The Industrial Production release was a reporting challenge this week. Expectations were for production to increase 0.1% in January, but the Federal Reserve reported a 0.1% decrease. At first glance, this appears to be disappointing, however production for November and December were revised up significantly, and total production in January was actually above expectations. Here are a few details …
First, Industrial Production is an index that is set to 100 for a base year, currently 2007. Production in December was originally reported as 98.1 (98.1% of 2007 production). Production in January was reported at 98.6 (98.6% of 2007 levels – yes, production is still below the pre-recession levels). That would have been a 0.5% increase, well above expectations. However production in December was revised up to 98.7, so production in January showed a slight decline.
This is a reminder that we need to look at more than one month of data and that headlines can be a little misleading. Overall – with revisions – the industrial production report was solid.
The key report for the week was January retail sales. This showed an increase of only 0.1% in January indicating sluggish retail sales growth. Retail sales are probably being impacted by the payroll tax increase. Two internal WalMart memo leaked this week suggest the largest US retailer is seeing weak sales, see from Bloomberg: Wal-Mart Executives Sweat Slow February Start in E-Mails. A couple of emails:
“In case you haven’t seen a sales report these days, February MTD sales are a total disaster,” Jerry Murray, Wal- Mart’s vice president of finance and logistics, said in a Feb. 12 e-mail to other executives, referring to month-to-date sales. “The worst start to a month I have seen in my ~7 years with the company.”
…
“Have you ever had one of those weeks where your best- prepared plans weren’t good enough to accomplish everything you set out to do?” [Cameron Geiger, senior vice president of Wal-Mart U.S. Replenishment] asked in a Feb. 1 e-mail to executives. “Well, we just had one of those weeks here at Walmart U.S. Where are all the customers? And where’s their money?”
This is probably an impact of the payroll tax increase.
And here is a summary of last week in graphs:
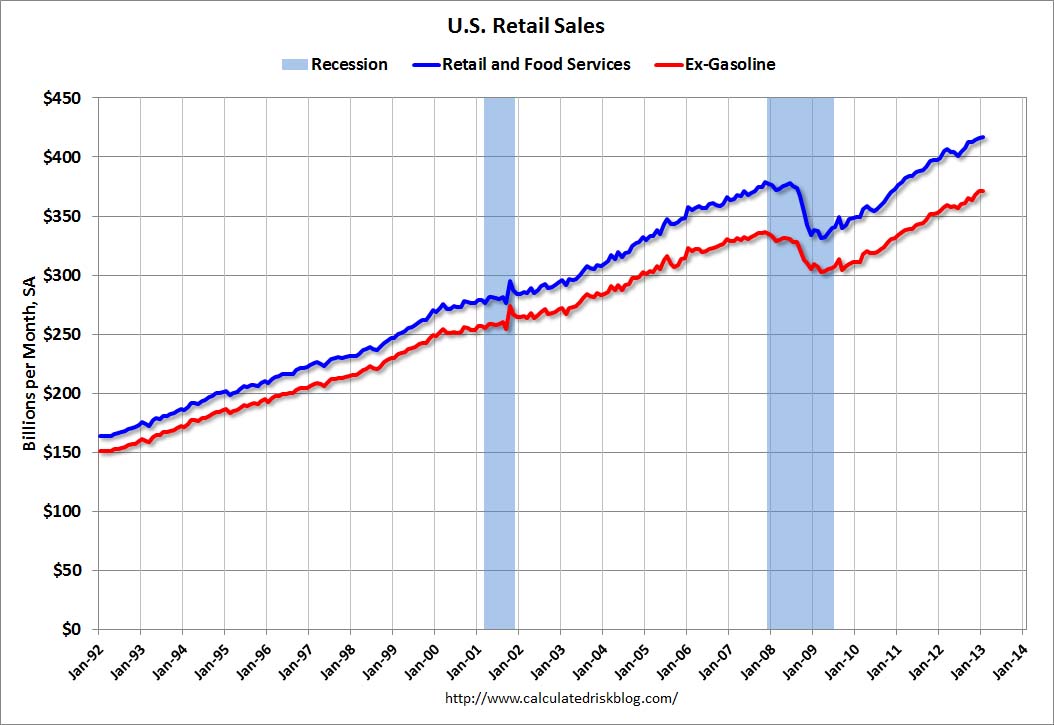
• Retail Sales increased 0.1% in January
 Click on graph for larger image.
On a monthly basis, retail sales increased 0.1% from December to January (seasonally adjusted), and sales were up 4.7% from January 2012. Sales for December were unrevised at a 0.5% gain.
This graph shows retail sales since 1992. This is monthly retail sales and food service, seasonally adjusted (total and ex-gasoline).
This was at the consensus forecast of a 0.1% increase, and might indicate some slowdown in retail spending growth related to the payroll tax increase.
• Fed: Industrial Production declined 0.1% in January
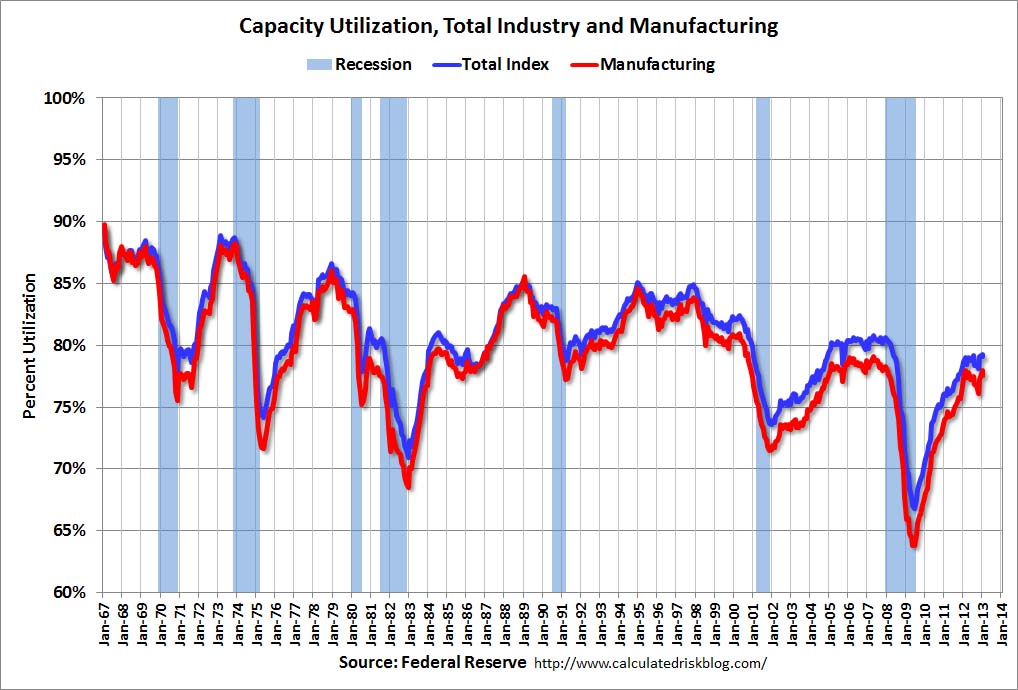 This graph shows Capacity Utilization. The capacity utilization rate for total industry decreased in January to 79.1 percent. This series is up 12.2 percentage points from the record low set in June 2009 (the series starts in 1967).
Capacity utilization at 79.1% is still 1.1 percentage points below its average from 1972 to 2010 and below the pre-recession level of 80.6% in December 2007. Note: December 2012 was revised up from 78.8%.
Note: y-axis doesn’t start at zero to better show the change.
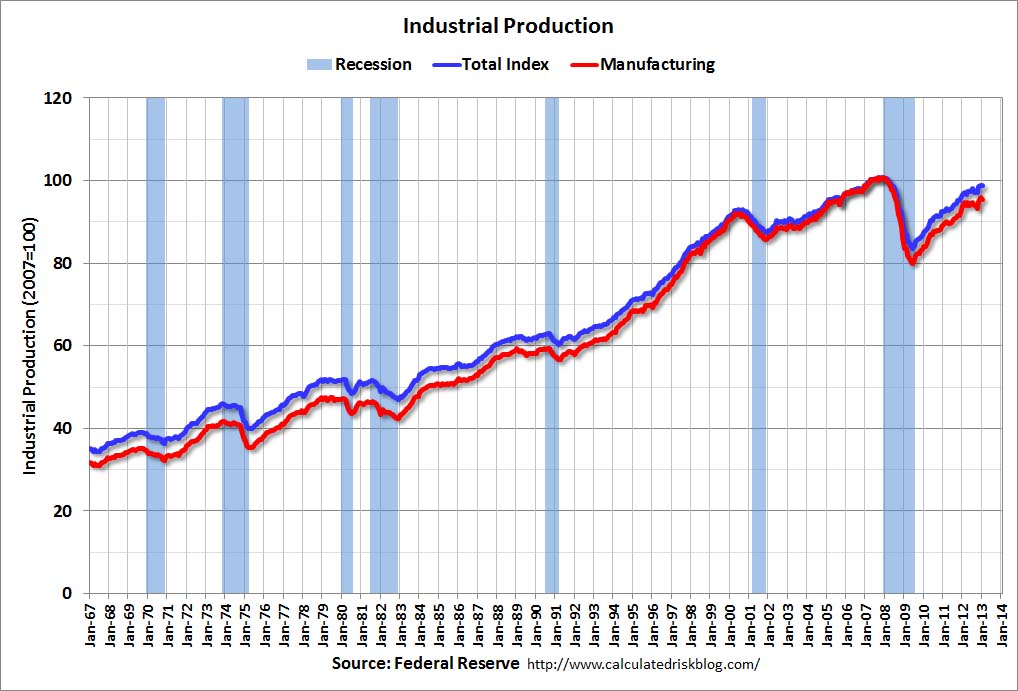 The second graph shows industrial production since 1967.
Industrial production decreased in January to 98.6 (December 2012 was revised up from 98.1). This is 18.2% above the recession low, but still 2.1% below the pre-recession peak.
The monthly change for both Industrial Production and Capacity Utilization were slightly below expectations, however the previous months were revised up significantly.
• Weekly Initial Unemployment Claims decline to 341,000
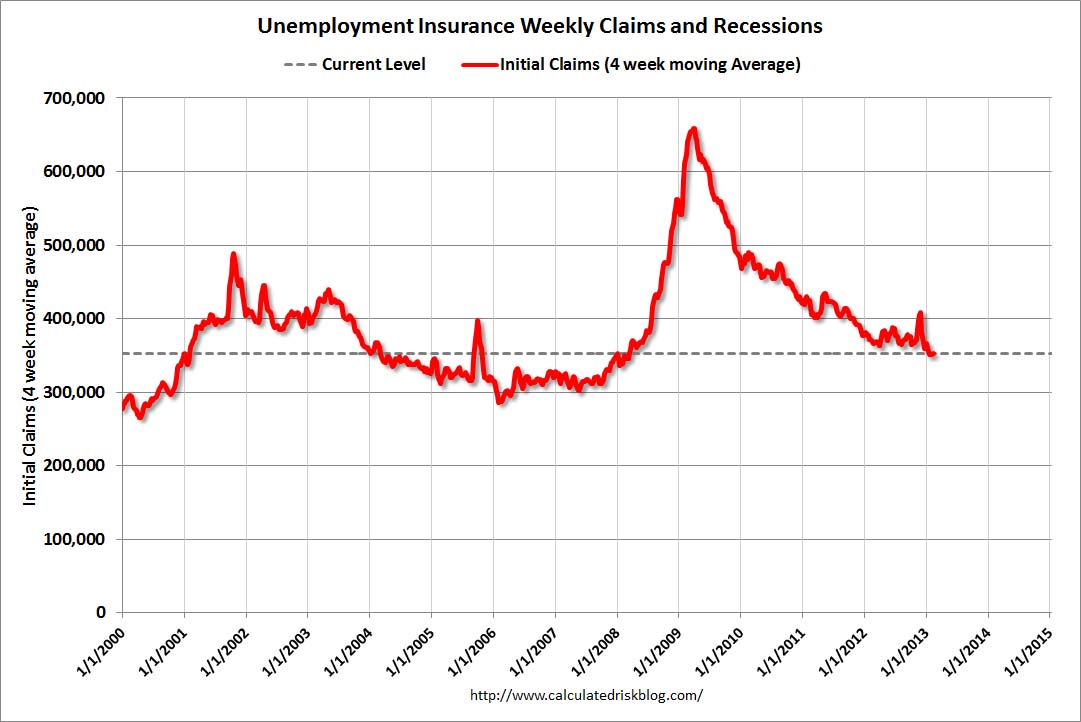 “In the week ending February 9, the advance figure for seasonally adjusted initial claims was 341,000, a decrease of 27,000 from the previous week’s revised figure of 368,000.”
The previous week was revised up from 366,000.
The dashed line on the graph is the current 4-week average. The four-week average of weekly unemployment claims increased to 352,500.
Weekly claims were below the 360,000 consensus forecast, and the 4-week average is close to the lowest level since early 2008.
• BLS: Job Openings “little changed” in December
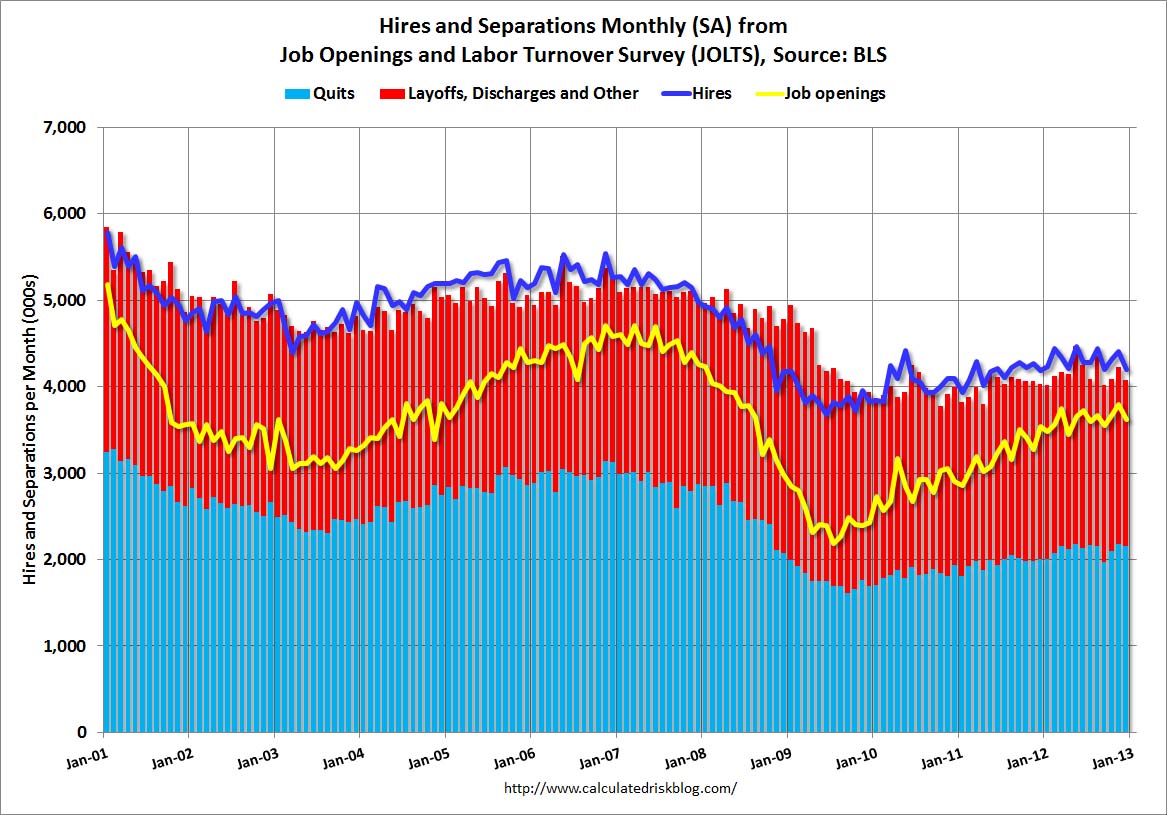 This graph shows job openings (yellow line), hires (dark blue), Layoff, Discharges and other (red column), and Quits (light blue column) from the JOLTS.
Jobs openings decreased in December to 3.617 million, down from 3.790 million in November. The number of job openings (yellow) has generally been trending up, but openings are only up 2% year-over-year compared to December 2011.
Quits decreased slightly in December, and quits are up 7% year-over-year. These are voluntary separations. (see light blue columns at bottom of graph for trend for “quits”).
Not much changes month-to-month in this report, but the trend suggests a gradually improving labor market.
• Preliminary February Consumer Sentiment increases to 76.3
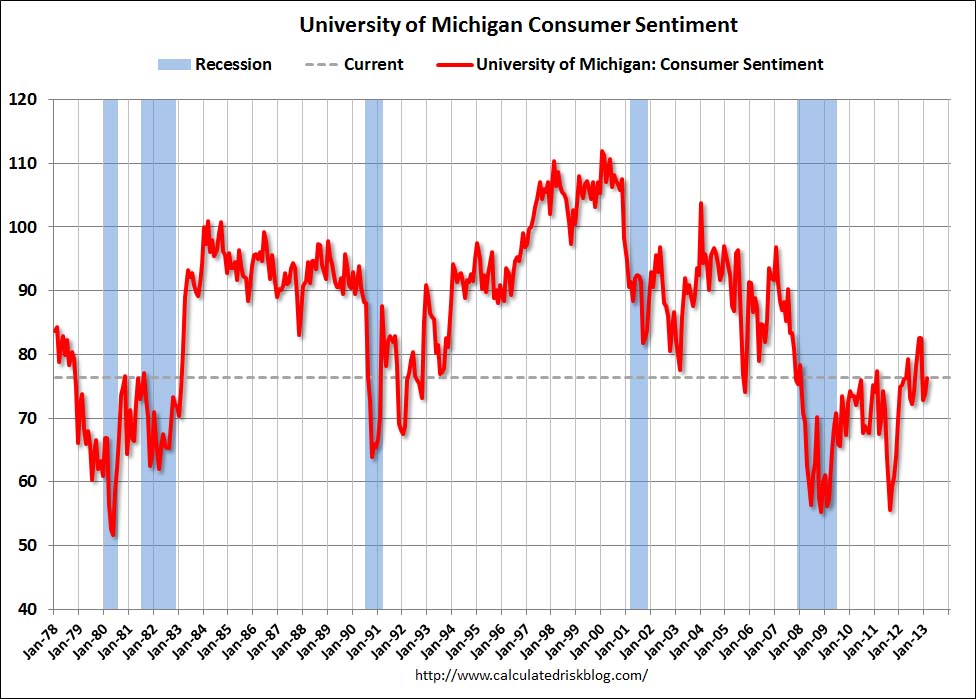 The preliminary Reuters / University of Michigan consumer sentiment index for February increased to 76.3 from the January reading of 73.8.
This was slightly above the consensus forecast of 75.0, but still very low. There are a number of factors that impact sentiment including unemployment, gasoline prices and, for 2013, the payroll tax increase and the default threat from Congress. People will slowly adjust to the payroll tax increase, and the threat of default is now behind us … and sentiment has improved a little.