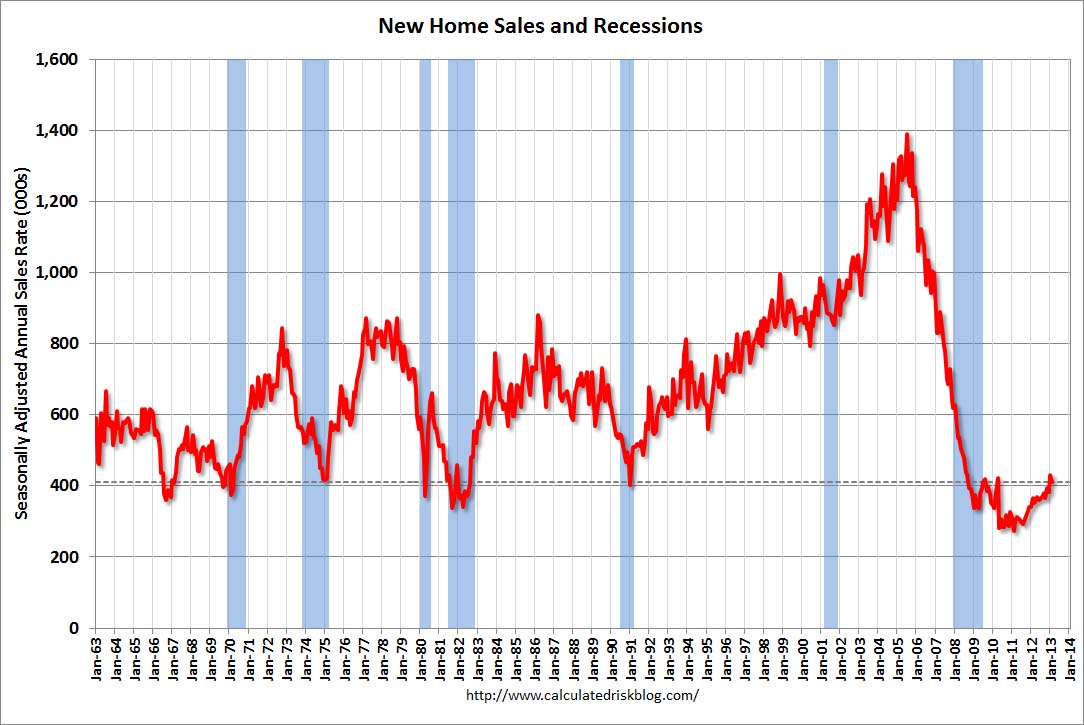
The Census Bureau reports New Home Sales in February were at a seasonally adjusted annual rate (SAAR) of 411 thousand. This was down from a revised 431 thousand SAAR in January (revised down from 437 thousand).
The first graph shows New Home Sales vs. recessions since 1963. The dashed line is the current sales rate.
“Sales of new single-family houses in February 2013 were at a seasonally adjusted annual rate of 411,000, according to estimates released jointly today by the U.S. Census Bureau and the Department of Housing and Urban Development. This is 4.6 percent below the revised January rate of 431,000, but is 12.3 percent above the February 2012 estimate of 366,000.
 Click on graph for larger image in graph gallery.
The second graph shows New Home Months of Supply.
The months of supply increased in February to 4.4 months from 4.2 months in January.
The all time record was 12.1 months of supply in January 2009.
 This is now in the normal range (less than 6 months supply is normal).
“The seasonally adjusted estimate of new houses for sale at the end of February was 152,000. This represents a supply of 4.4 months at the current sales rate.”
On inventory, according to the Census Bureau:
“A house is considered for sale when a permit to build has been issued in permit-issuing places or work has begun on the footings or foundation in nonpermit areas and a sales contract has not been signed nor a deposit accepted.”
Starting in 1973 the Census Bureau broke this down into three categories: Not Started, Under Construction, and Completed.
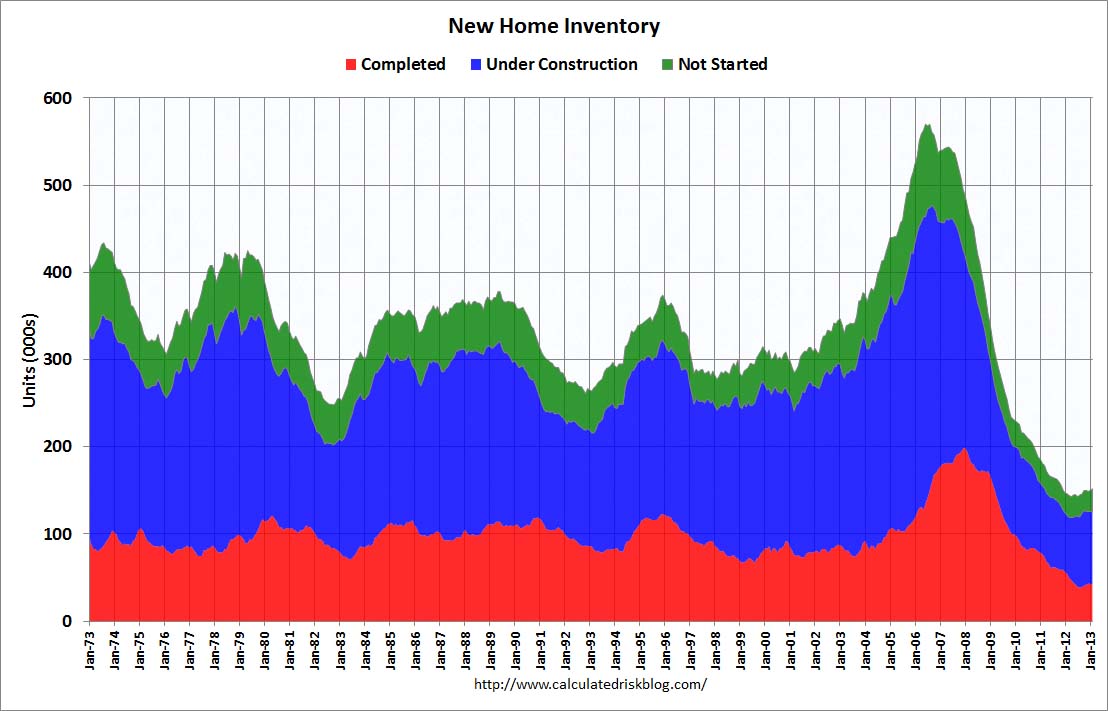 This graph shows the three categories of inventory starting in 1973.
The inventory of completed homes for sale is just above the record low. The combined total of completed and under construction is also just above the record low.
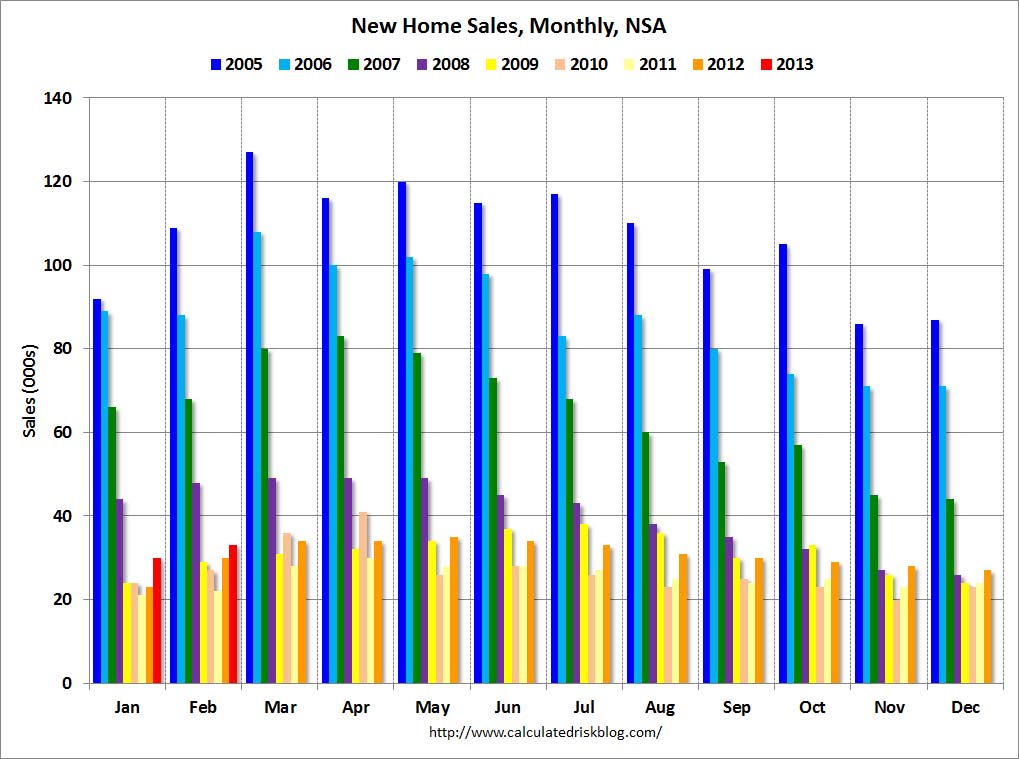
The last graph shows sales NSA (monthly sales, not seasonally adjusted annual rate).
In February 2013 (red column), 33 thousand new homes were sold (NSA). Last year 30 thousand homes were sold in February. This was the eight weakest February since this data has been tracked. The high for February was 109 thousand in 2005, and the low for February was 22 thousand in 2011.
This was below expectations of 425,000 sales in February, but still a fairly solid report. I’ll have more soon …